
How to Verify a Reported Event with Free Satellite Imagery: An OSINT Workflow
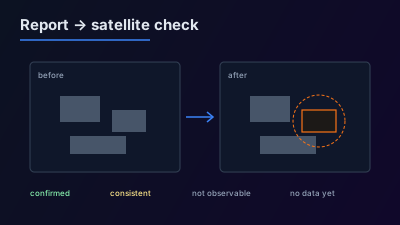
Quick Answer: To verify a reported event with free satellite imagery, fix the place and the time window first, then pick the sensor that matches the claim: NASA FIRMS for active fire, Sentinel-2 (10 m optical, 5-day revisit at the Equator) for burn scars, flooding and large structural change, and Sentinel-1 radar when cloud or darkness blocks optical. Compare one image from before the reported time with one from after, taken on the same geometry, and record the result as confirmed, consistent, not observable, or no data yet. Free imagery can show that something of a certain size changed; it cannot identify who did it or what a vehicle is.
A report says a depot burned, a bridge was hit, or a river left its banks. Free satellite imagery can often check that claim, but only if the question is narrowed first. The workflow is short: fix where and when, choose the sensor that matches the claim, find one image before and one after, compare them on the same geometry, and write down exactly what the imagery supports. This guide walks through each step with the free sources an OSINT analyst can open today.
What can free satellite imagery actually confirm?
Free satellite imagery confirms physical change that is large compared with a pixel: a burn scar, a flooded field, a missing roof on a large building, a new berm or a cleared plot. It does not identify people, vehicle types or markings, and it says nothing about who caused the change. The limit is resolution, not effort.
The Sentinel-2 instrument samples 13 spectral bands, four of them at 10 m (blue, green, red and near-infrared), with the rest at 20 m and 60 m. At 10 m a car is smaller than one pixel and a house is a handful of pixels. A warehouse, a runway, a fuel-tank farm or a ship is many pixels and can be detected. The distinction between detecting that something is there and identifying what it is appears in more detail in the four types of satellite image resolution.
A useful test before opening any imagery: would the claimed change cover at least a few pixels? If the report is about a single vehicle or a small crater, free imagery will not settle it, and the honest result is "not observable at this resolution". A target-by-target breakdown is in what you can actually see in 10 m satellite imagery.
Step 1: Where exactly did it happen, and when?
Verification starts with two numbers: a coordinate and a time window. A report that names only a city or a district is not yet checkable, because a 10 m image of a whole city shows thousands of buildings and no way to know which one the report means. Narrow the place to a facility, a street or a field before looking.
Work from the report outward:
- Place. Look for a named facility, a road junction, a landmark visible in a photo, or coordinates in an official notice. If several places share the name, the surrounding text (province, river, nearby town) usually decides it.
- Time. Note the earliest credible report time, not the time an article was published. The event happened before the first report, so the "before" image must predate that.
- Size. Estimate how large the claimed change is on the ground. This decides whether free imagery is worth opening at all.
If the place cannot be narrowed below a town, record that and stop. Guessing a location and then finding "something" there is the most common way to produce a false confirmation.
Step 2: Which free sensor matches the claim?
Each free sensor answers a different question, so the claim decides the sensor. Optical imagery shows colour and burn scars but needs daylight and clear sky. Radar sees through cloud and at night but shows surface roughness and structure, not colour. Thermal fire detections show heat at the time of the overpass and nothing afterwards.
| Claim in the report | Free source to open first | What a real event looks like | What it cannot tell you |
|---|---|---|---|
| Something is burning now | NASA FIRMS active fire detections | A hotspot at or near the location within hours of the report | The size of the fire or what is burning |
| A fire or explosion happened days ago | Sentinel-2 | A dark burn scar that was not there before, clearest in infrared band combinations | The cause |
| A building or bridge was destroyed | Sentinel-2, then Sentinel-1 | A changed outline, missing roof, debris field or changed radar return | Damage smaller than a few pixels |
| Flooding | Sentinel-1 | Land that was bright on radar turning dark and smooth | Water depth |
| Ships gathering at a port or anchorage | Sentinel-1 | Bright point returns on dark water | Ship identity or flag |
| Construction, clearing, earthworks | Sentinel-2 | New bare soil, straight edges, changed vegetation | Purpose of the work |
Sentinel-1 is a C-band radar with a centre frequency of 5.405 GHz that images day and night regardless of the weather. That makes it the fallback whenever an optical image over the site is cloudy. Reading radar takes some practice; SAR vs optical: when to use which covers the differences, and false color composites explains why infrared combinations show burn scars better than natural colour.
Step 3: How do you find one image from before and one from after?
A satellite confirms change only by comparison, so the task is to find the last clear image before the reported time and the first clear image after it. How long the wait for the "after" image is depends on each satellite's revisit, and it is known in advance.
- Sentinel-2. The two-satellite mission is designed to give a revisit of 5 days at the Equator, with a 290 km swath. Cloud can make the practical gap much longer.
- Sentinel-1. A single satellite has a 12-day repeat cycle, and the two-satellite constellation a six-day repeat cycle. Cloud does not matter.
- NASA FIRMS. Fire detections are available within 3 hours of a satellite observation, on a best-effort basis.
Sentinel data are made available free of charge to all users, including the general public and commercial users, so nothing in this step requires a purchase. Where to look, source by source, is covered in how to find the most recent satellite image of any place.
If no image exists yet after the reported time, the correct result is "no data yet", with the date of the next expected pass. When can a satellite next image this place? explains how that date is worked out from public orbit data.
Step 4: How do you compare the two images without fooling yourself?
Compare like with like. Two images of the same place can differ for reasons that have nothing to do with the event: sun angle, season, cloud shadow, tide, or, for radar, the direction the satellite was looking. Remove those differences first, and treat whatever change remains as the candidate.
- Use the same viewing geometry for radar. Sentinel-1 images taken on ascending and descending passes look at the ground from opposite sides, so slopes and tall structures shift and brighten differently. Compare ascending with ascending, or descending with descending. Ascending vs descending SAR orbits shows why.
- Check cloud and cloud shadow. A dark patch that appears in one optical image may be a shadow. Look for the matching cloud nearby, and check a third date.
- Look at a third image from well before. If the "change" is also present a month earlier, it is not the event.
- Mind the season. Fields are ploughed, burned and harvested on a schedule. A burn scar in farmland during burning season is weak evidence of anything else.
- Stay near the reported location. Change found two kilometres away is a different observation and needs its own justification.
For radar, a more sensitive method than comparing brightness is coherence, which measures whether the fine structure of the surface stayed the same between two passes. It is covered in SAR coherence for change detection.
Step 5: What do fire detections add, and how far can they be trusted?
Fire detections are the fastest free evidence that something hot was present, and the easiest to over-read. A hotspot near the reported place at the reported time supports the claim that a fire occurred. It does not show what burned, how large the fire was, or why it started.
NASA states the limits directly in its FIRMS documentation:
Each hotspot/active fire detection represents the center of a pixel flagged as containing one or more fires or other thermal anomalies (such as volcanoes).
The same page notes that the exact location and size of the fire cannot be determined, only that at least one fire lies within the flagged pixel, and that cloud cover, heavy smoke or tree canopy may completely obscure a fire. The VIIRS detections are at 375 m and the MODIS detections at about 1 km, so a hotspot can sit several hundred metres from the thing that burned.
Two consequences follow. A missing hotspot does not mean there was no fire: the satellite may not have passed while it burned, or cloud may have hidden it. And a hotspot alone is not confirmation of a strike: the detection flags a thermal anomaly of any origin (the definition above lists volcanoes), so heat from an ordinary fire looks the same as heat from an attack. Pair a hotspot with a later Sentinel-2 burn scar, described in wildfire burn scar mapping with NBR, before calling the event confirmed. The combined method is in confirming and dating a reported fire with satellite data.
How should the result be written down?
Write the result as one of four outcomes, and state the dates and sensors behind it. This keeps a finding from being read as stronger than it is, and it lets someone else repeat the check.
| Outcome | When to use it | Example wording |
|---|---|---|
| Confirmed | A change of the claimed kind and size appears at the reported place between the before and after images | "Sentinel-2 images from 3 and 8 May show a new burn scar of roughly 200 m by 150 m at the depot" |
| Consistent | Evidence fits the report but could have another cause | "A VIIRS hotspot was detected within 400 m on the reported night; no clear optical image yet" |
| Not observable | The claimed change is too small, or the sensor cannot see that kind of change | "Damage to a single vehicle is below the 10 m resolution of the available imagery" |
| No data yet | No usable image exists after the reported time | "Both passes since the report were cloud-covered; the next radar pass is expected on 12 May" |
The dates and sizes in the example wording are illustrative, not taken from a real case.
Absence of visible change is not proof that nothing happened. It means that nothing large enough to see changed at that place between those two dates. Say exactly that.
Where can each step be done in a browser?
Every step above can be done with free data and no GIS software. Off-Nadir Delta puts the sources in one place, and several of the tools work without an account:
- The live fire map shows NASA FIRMS VIIRS and MODIS detections for any day, with no login.
- The Sentinel-2 viewer shows recent Sentinel-2 passes in natural colour on a live map, with no login.
- The Sentinel-1 SAR viewer covers radar imagery for cloudy or night-time cases.
- Satellite pass prediction works out when a place can next be imaged and by which satellite.
- The Watchfloor lists geolocated world events with their sources and marks whether a satellite could observe each one.
For a comparison of these and other tools by task, see best OSINT satellite imagery tools. For the wider discipline this workflow belongs to, see what is geospatial OSINT? and the glossary.
What are the most common mistakes?
Most false confirmations come from skipping a step, not from misreading pixels. The same five errors recur:
- Searching a whole city. Without a precise place, some change will always be found somewhere.
- Using an "after" image taken before the event. Check acquisition times against the earliest report, in the same time zone.
- Comparing radar images from opposite orbit directions. The difference is geometry, not damage.
- Treating a fire hotspot as proof of an attack. It is proof of heat.
- Reporting "nothing happened" from a clear image. Report what was not visible, at what resolution, on what date.
Free imagery is strongest when it is used to narrow a claim: this place, this size of change, between these two dates. Stated that way, a result can be checked by anyone with the same data.

Remote sensing specialist with 10+ years in satellite data processing and AI. Founder of Off-Nadir Lab. Ph.D. in Informatics (Yokohama National University, 2026). Master's in Earth System Science and Technology (Kyushu University). Co-author, Remote Sensing Encyclopedia. More about the author →