
What Free Satellite Imagery Can and Cannot Show of a War
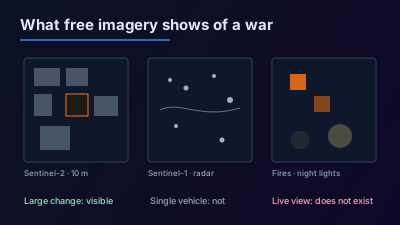
Quick Answer: Free satellite data shows a war zone only at the scale of its pixels and only on the days a satellite passes. Sentinel-2 (10 m optical, about every 5 days with two satellites) shows burn scars, large destroyed buildings and earthworks when the sky is clear; Sentinel-1 radar (C-band, through cloud and at night) shows large structural and surface change; NASA FIRMS flags heat at 375 m to 1 km pixels within about 3 hours of an overpass; VIIRS night lights show whole districts going dark. Building-by-building damage counts, such as UNOSAT's Gaza assessments, are made from 30 to 50 cm commercial imagery. No free or public source offers a live view of a battlefield.
Free satellite imagery of a war zone exists, and anyone can open it, but it is coarser and less frequent than most people expect. A free optical image has 10 m pixels and arrives every few days if the sky is clear. A free radar image sees through cloud but shows texture, not photographs. Fire and night-light data arrive within hours but at hundreds of metres per pixel. The building-by-building damage maps that appear in the news are made from commercial imagery at 30 to 50 cm, by specialist teams, and published days or weeks later.
This guide goes source by source: what each free dataset can detect in a conflict zone, what it cannot, where the published damage assessments come from, and how imagery gets misread.
Is there a live satellite view of a war?
No. No free or public source gives a live, zoomable view of a battlefield. Earth-observation satellites in low orbit pass over a given place at intervals of days, take one picture, and move on; the image is then processed and published hours later. What looks "live" online is usually the most recent available image, which may be days old, or a weather-satellite view at a scale far too coarse to show any building.
The numbers make the point. The two Sentinel-2 satellites together revisit regular areas every 5 days, and each one every 10 days. A single Sentinel-1 radar satellite has a 12-day repeat cycle. The fastest free product here, NASA FIRMS active fires, is published in near real time, defined by NASA as "within 3 hours of a satellite observation (on a best-effort basis)", and only for the moments a satellite happened to be overhead.
Commercial operators can point their satellites at a requested place and collect more often, but their imagery is sold or released selectively, not streamed to the public. A claim that a website shows a war "live from space" should be read as "the latest image we have, of unknown age" until the acquisition date is shown.
Which free satellite data is available over a conflict zone?
Four free sources cover any conflict zone on Earth on a regular schedule: Sentinel-2 optical imagery, Sentinel-1 radar imagery, NASA FIRMS active-fire detections and VIIRS night-time lights. The Copernicus Data Space Ecosystem describes its service as providing "free instant access to a wide range of data and services from the Copernicus Sentinel missions", and the NASA products are open as well. None of them requires anyone's permission to view a particular country.
| Source | Pixel size | How often | Works through cloud or at night? | What it can show in a conflict zone |
|---|---|---|---|---|
| Sentinel-2 (optical) | 10 m (4 bands), 20 m, 60 m | About every 5 days with two satellites | No | Burn scars, large destroyed buildings, earthworks, flooded land |
| Sentinel-1 (C-band radar) | 5 m × 20 m single look (IW mode) | 12 days per satellite | Yes | Large structural change, ships, cleared or disturbed ground |
| NASA FIRMS (VIIRS / MODIS) | About 375 m / about 1 km | Published within about 3 hours of each pass | Not through cloud or thick smoke | Where something hot was burning at the moment of a pass |
| VIIRS Day/Night Band | 750 m | Daily composites | At night only; cloud blocks it | Whole towns or districts losing or regaining electric light |
The figures in the table are from the Sentinel-2 mission page, the Sentinel-1 mission page, the FIRMS FAQ and NASA's Black Marble page. A general overview of the free archives is in free satellite data sources explained.
What can Sentinel-2 show of war damage?
Sentinel-2 can show damage that is large compared with a 10 m pixel: a burned field or forest, a block of collapsed buildings, a destroyed warehouse, a new trench line or berm, a crater field, a breached dam and the flooding behind it. It cannot show a single vehicle, a small crater, a damaged roof on a house, or anything that would identify who caused the damage.
The instrument samples 13 spectral bands: four at 10 m, six at 20 m and three at 60 m, across a 290 km swath. At 10 m a car is smaller than one pixel and a family house is a handful of pixels, so individual houses cannot be graded as damaged or intact. A target-by-target breakdown, with the pixel arithmetic, is in what you can actually see in 10 m satellite imagery.
The 20 m short-wave infrared bands are often more useful in a conflict zone than the natural-colour view, because burned ground and active fire stand out in them more clearly than in visible light. The main limit is weather: Sentinel-2 is an optical camera and sees nothing through cloud. In a cloudy season, a 5-day revisit can produce several weeks without a usable image of the same place.
As of the mission page, the nominal pair is Sentinel-2B and Sentinel-2C; Sentinel-2C replaced Sentinel-2A as the primary operational satellite on 21 January 2025, and Sentinel-2A continues in an extension campaign.
What can Sentinel-1 radar show that optical imagery cannot?
Sentinel-1 is a C-band synthetic aperture radar that observes day and night, regardless of weather, so it produces an image on schedule even when clouds or smoke hide the ground. That makes it the free source most likely to have an image of a contested place on a given week.
Radar measures how strongly the surface reflects microwaves back to the satellite, not colour. Standing buildings, with their walls and corners, tend to return strong signals; rubble usually returns a different, weaker and more uniform signal. Comparing two radar images taken on the same orbit before and after an event can therefore show where large groups of buildings changed, and where ground was disturbed. Ships appear as bright points on dark water.
The limits are as important as the strengths. In the main land mode (Interferometric Wide swath) the resolution is 5 m by 20 m across a 250 km swath, so radar does not grade single houses either. Radar images contain shadows and layover on slopes and in dense streets, and two images taken from different orbits can show "change" where nothing changed. For the mission status, ESA's page lists Sentinel-1C as fully operational since May 2025 and Sentinel-1D, launched in November 2025, as the satellite planned to take over from Sentinel-1A at the end of June 2026. An introduction to reading the images is in getting started with Sentinel-1 SAR.
What do NASA FIRMS fire detections mean in a war zone?
A FIRMS detection means that a satellite pixel was hotter than its surroundings at the moment of a pass. In a conflict zone that can be a fire caused by shelling, a burning fuel depot, a crop fire, a gas flare or an industrial heat source. FIRMS does not say which.
NASA's own FAQ is explicit on three points that matter for conflict monitoring:
- The coordinates are "the center point of the pixel (not necessarily the coordinates of the actual fire)", and the pixel is about 375 m (VIIRS) or about 1 km (MODIS) near nadir, larger toward the edge of the scan.
- Several fires within one pixel look the same as a single fire, and the near-real-time data do not attribute the type of thermal anomaly.
- Cloud or heavy smoke can hide a fire completely, so a missing detection does not mean there was no fire.
FIRMS is therefore good at answering "was something large burning near this place on this day?" and poor at answering "was this building hit?". A detection is a reason to look at Sentinel-2 or Sentinel-1 imagery of the same place; it is not a confirmation of a strike. The product is covered in depth in NASA FIRMS active fire monitoring, and the live map is at /active-fire-map.
What can night-time lights show about a conflict?
Night-time light data shows whether a city or district is lit after dark, and how that compares with its usual level. A sharp, lasting drop can indicate a power outage, damage to the grid, or a population that has left; a recovery can indicate repairs. NASA's Black Marble products, built from the VIIRS Day/Night Band, are described by NASA as a record used for "assessments of disruptions and recovery following disasters and other major events", and the page notes it supports "providing data to humanitarian organizations in conflict areas."
The scale is coarse: the Day/Night Band has a spatial resolution of 750 m, so night lights speak about neighbourhoods and towns, not buildings. Darkness has several causes besides damage, including scheduled outages, blackout measures, clouds, snow and moonlight, and the same NASA page describes corrections for lunar, atmospheric, terrain and stray-light effects for exactly that reason.
One change is coming. NASA's Black Marble page states: "Delivery of new Suomi NPP data ceases on Nov. 2, 2026. Users should transition to alternative products." The same page lists a NOAA-20 version of the product (VJ146) available from 2018. Anyone building a night-light series over a conflict zone should check which satellite each night came from. More on reading the data is in VIIRS night-time lights time-series monitoring.
What needs commercial sub-metre imagery?
Anything at the scale of a single building, vehicle or crater needs commercial imagery, usually at 30 to 50 cm per pixel. That includes counting destroyed versus damaged houses, identifying aircraft or vehicle types, seeing a hole in a roof, and checking a claim about a specific address.
The published UN damage assessments show what this requires in practice. UNOSAT's comprehensive damage assessment of the Gaza Strip, with imagery analysis dated 11 October 2025 and published 31 October 2025, lists WorldView-3 imagery at 30 cm and WorldView-2 imagery at 50 cm, plus Pléiades Neo at 30 cm for the overview map (UNOSAT product PDF). The same document compares the October 2025 images with images from 16 earlier dates back to May 2023. Neither the resolution nor the stack of before images is available from free sources.
Commercial imagery is sold under licences and released at the provider's discretion. When it appears in the news, it has been selected, and its date and resolution are worth checking before drawing conclusions from it.
How do UNOSAT and Copernicus EMS publish damage assessments?
The two best-known public damage assessments come from the UN Satellite Centre (UNOSAT) and the European Union's Copernicus Emergency Management Service (CEMS). Both publish maps and data made by analysts from very high resolution imagery, and both state the limits of what their products show.
UNOSAT is part of UNITAR and supplies "United Nations funds, programmes and specialized agencies with satellite analysis"; its maps and data are published on unosat.org. The Gaza Strip assessment cited above reports, as of 11 October 2025, that "approximately 81% of all structures in the Gaza Strip are damaged", in four classes: 123,464 destroyed, 17,116 severely damaged, 33,857 moderately damaged and 23,836 possibly damaged, 198,273 in total over a 361 km² area of interest. It ends with the sentence: "This is a preliminary analysis and has not yet been validated in the field." (UNOSAT, 31 October 2025). These are counts of structures assessed from above, not counts of people.
Copernicus EMS Rapid Mapping can be requested only by an Authorised User: the CEMS page lists national focal points in EU Member States and in countries participating in the EU Civil Protection Mechanism, European Commission services, the EEAS Situation Room and EU delegations. The public can follow activations on the website "except where sensitivity restrictions apply". Its product portfolio includes a First Estimate Product, delineation products, grading products that "provide information about the damage grade, its spatial distribution and extent", and pre-event reference products. The service overview says information is provided "within hours or days".
A longer description of how rapid-mapping activations run, step by step, is in rapid damage mapping: the satellite workflow.
Why is satellite evidence of war damage delayed and easy to misread?
Satellite evidence lags events for three reasons: a satellite has to pass over the place, the sky has to be clear for optical sensors, and someone has to process and interpret the image. It is easy to misread because the view is from directly above, at a fixed resolution, on one particular day.
Copernicus EMS publishes its own list of limitations when using Earth observation data, and every item applies to conflict damage:
- "Cloud cover obscures the area."
- "Collapsed buildings may not be clearly visible from above."
- Damage can be "too small to be visible".
- An image may be "acquired outside an optimal event window".
- As a result, "the impacts of disasters may be underestimated during analysis."
To these, conflict adds its own pitfalls. A burn scar shows that something burned, not who set the fire. Two images taken from different angles or orbits can show differences that are only geometry. A dark town at night may be under a deliberate blackout rather than damaged. An image circulated online may carry the wrong date or place. The safe practice is to record the acquisition date and sensor for every image, compare images taken on the same geometry, and write down what the imagery cannot show alongside what it does. A step-by-step version of that practice is in how to verify a reported event with free satellite imagery.
Consider a hypothetical scenario: a report says a fuel depot was hit on a Tuesday night. FIRMS shows a detection within 1 km of the depot on Wednesday's early pass. The next clear Sentinel-2 image is eight days later and shows a dark scar where several tanks stood. Together these are consistent with a large fire at the depot within that window. They do not show what caused it, exactly when it started, or whether anyone was hurt, and the write-up should say so.
How can you look at a conflict zone in Off-Nadir Delta?
Off-Nadir Delta shows the free sources above on its map and labels each reported event by whether a satellite could see it at all. What is free and what is paid:
- Sentinel-2 and Sentinel-1 viewers. The Sentinel-2 viewer and the Sentinel-1 SAR viewer show recent passes on a live map with no login. With a free account, the full map can search scenes by date and load two dates as two separate layers, so the before and after can be switched between. Automated difference analysis is a paid feature.
- Active fires. The active fire map shows NASA FIRMS detections for any day, free and without login.
- Night lights. The VIIRS night-light imagery layer is on paid plans. The night-light anomaly marks, which flag a monitored city whose measured lights fell below half of its usual level, appear on the Watchfloor for every account; the detail of each record is plan-dependent.
- "Could a satellite see it?" Each reported event on the Watchfloor carries a label: "Observable from orbit", "Location too coarse to image" (what happened is visible from space, but the reports do not pin the place precisely enough), or "Nothing visible from orbit". The label is an assessment of whether imagery could show the event, not a statement that a satellite has confirmed it. The free Watchfloor history covers the last few days.
- Country pages. Pages such as /situation/ukraine, /situation/israel and /situation/iran collect recent geolocated events for one country.
The product does not provide commercial sub-metre imagery, and nothing in it is a live view.
What is the honest summary?
Free satellite data can establish that something large changed in a conflict zone, roughly when, and roughly where: burned areas, destroyed blocks, new earthworks, fires on a given day, towns going dark. It cannot count damaged houses, identify weapons or units, attribute responsibility, or count casualties. Building-level damage figures come from commercial imagery analysed by bodies such as UNOSAT and Copernicus EMS, which date their products and label them preliminary. Treat any image of a war as a dated, partial observation, and check the date first.

Remote sensing specialist with 10+ years in satellite data processing and AI. Founder of Off-Nadir Lab. Ph.D. in Informatics (Yokohama National University, 2026). Master's in Earth System Science and Technology (Kyushu University). Co-author, Remote Sensing Encyclopedia. More about the author →