
Was There a Fire, and When? Confirming and Dating a Reported Fire with Satellite Data
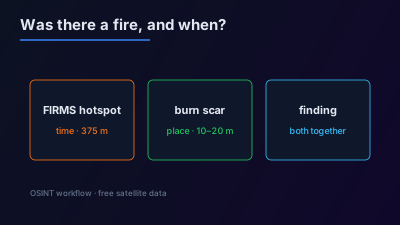
Quick Answer: A reported fire can be checked with two free sources. NASA FIRMS thermal detections show heat at the moment of a satellite overpass, at 375 m (VIIRS) or about 1 km (MODIS), and are available within 3 hours. Sentinel-2 shows the burn scar afterwards at 10 to 20 m. The detection times bracket when the fire burned, and the last clear image before and the first after bracket when the scar appeared. A hotspot proves heat, not cause: NASA notes that some detections are volcanoes or gas flares.
A report says a warehouse, a fuel depot or a stretch of forest burned. Two free satellite sources can check it, and they answer different halves of the question. Thermal fire detections say that something was hot at a specific moment. A burn scar in optical imagery says that something burned at some point between two dates. Used together they confirm the fire and narrow down when it happened.
What does a satellite fire detection actually record?
A fire detection records that a satellite sensor saw a pixel much hotter than its surroundings at the moment it passed overhead. It is a measurement of heat, with a time and a place, and nothing more. NASA's FIRMS documentation defines it this way:
Each hotspot/active fire detection represents the center of a pixel flagged as containing one or more fires or other thermal anomalies (such as volcanoes).
The same documentation states the limits: the exact location and size of the fire cannot be determined, only that at least one fire is located within the flagged pixel. VIIRS detections are at 375 m and MODIS detections at about 1 km, so the plotted point can be hundreds of metres from the thing that burned.
Detections reach the public quickly. NASA states that global data are available within 3 hours of a satellite observation on a best-effort basis.
When do the satellites pass over?
The satellites pass at fixed local times, which is what makes dating possible. According to NASA FIRMS, Suomi NPP crosses the Equator at approximately 1:30 p.m. and 1:30 a.m. mean local time, with NOAA-20 and NOAA-21 about 50 minutes ahead of it. For MODIS, Terra crosses at approximately 10:30 a.m. and 10:30 p.m. and Aqua at approximately 1:30 p.m. and 1:30 a.m.
NASA adds that mid-latitudes get 3 to 4 VIIRS looks a day, and that there are at least four daily MODIS observations for almost every area on the Equator, with more toward the poles.
The practical meaning: a fire is observed a few times a day, at known hours. A fire that starts and is put out between two overpasses is never detected. A fire that burns for a day is detected several times.
How do fire detections narrow down when a fire started?
Each detection carries the time of the overpass, so the first detection at a place gives the latest time the fire could have started, and the last overpass without a detection gives the earliest. The start lies between the two.
Work through it in order:
- Find the first detection at or near the reported place. The fire was burning at that time.
- Find the overpass before it with no detection. If the sky was clear at that overpass, the fire had probably not started, or was too small to detect.
- Find the last detection. After the next clear overpass without one, the fire had cooled below the detection limit.
- Compare with the report. A first detection hours before the earliest report is normal. A first detection days before it means the report is late, or describes something else.
The weak link is step 2. NASA notes that cloud cover, heavy smoke or tree canopy may completely obscure a fire, so an overpass with no detection is not proof of no fire. Check whether the area was cloudy at that time before using the gap as evidence.
How does a burn scar confirm the fire afterwards?
A burn scar is the lasting evidence. Burned vegetation and charred structures reflect less near-infrared light and more shortwave-infrared light than they did before, and the change remains visible after the fire is out. A Sentinel-2 image after the fire shows the extent of what burned at 10 to 20 m, far finer than the thermal detection.
The standard measure is the Normalized Burn Ratio. The USGS defines it as a ratio between the near-infrared and shortwave-infrared values, (NIR - SWIR) / (NIR + SWIR), "used to identify burned areas and provide a measure of burn severity". Comparing the ratio before and after the fire isolates the burned area from land that was already dark.
Sentinel-2 provides the bands this needs: its instrument samples 13 spectral bands, four at 10 m and six at 20 m, and the mission is designed for a revisit of 5 days at the Equator. The method is covered step by step in wildfire burn scar mapping with NBR, and the reason infrared shows scars better than natural colour is in false color composites.
How do the two sources combine into one finding?
The thermal detections give the time, and the burn scar gives the place and extent. Each covers the weakness of the other: detections are prompt but coarse, and the scar is precise but arrives days later and carries no time of its own beyond the dates of the two images that bracket it.
| Question | Fire detections (FIRMS) | Burn scar (Sentinel-2) |
|---|---|---|
| Was something hot or burned? | Yes, at the overpass time | Yes, between two image dates |
| Where exactly? | Within a 375 m or 1 km pixel | To within 10 to 20 m |
| When? | To within hours, between overpasses | Between the last clear image before and the first after |
| How large? | Not determined | Measured from the scar |
| Works under cloud? | No | No |
| How soon? | Within about 3 hours | At the next clear pass |
A finding built from both reads like this: "VIIRS detected heat within 400 m of the site at two consecutive night overpasses; the first clear Sentinel-2 image afterwards shows a new burn scar covering the northern half of the compound." The distances and details in that sentence are illustrative, not from a real case.
If both sources are blocked by cloud, Sentinel-1 radar still images the site. It does not show heat or charring, but it can show that a structure changed. See how to verify a reported event with free satellite imagery for the full workflow.
What can a fire detection not prove?
A fire detection cannot prove cause, and it cannot prove that the reported target is what burned. NASA states that not all hotspots are vegetation fires: sometimes a hotspot is a volcanic eruption or the flare from a gas well, and different types of thermal anomalies are not attributed in the near-real-time data.
Before treating a hotspot as confirmation of a reported event, rule out the ordinary explanations:
- Is there a hotspot at this place on most days? A site that is hot every night is an industrial source or a flare. Check the same place a month earlier.
- Is it burning season? Detections scattered across farmland at harvest time are agricultural fires.
- Does the size fit? NASA notes that MODIS routinely detects fires of 1,000 square metres, and smaller flaming fires under very good conditions. A small fire may produce no detection at all.
- How confident is the detection? FIRMS assigns low, nominal or high confidence to VIIRS detections; low-confidence daytime pixels are typically associated with Sun glint.
A detection that survives these checks, at the right place and time, supports the statement that a significant fire occurred there. Attribution needs other evidence.
Where can this be done in a browser?
Both sources are free and can be opened without GIS software. The Off-Nadir Delta live fire map shows NASA FIRMS VIIRS and MODIS detections for any day with no login, which answers on which days a place had detections. It shows detections by day, so for the overpass time of each individual detection, go to NASA FIRMS directly. The Sentinel-2 viewer shows recent Sentinel-2 passes for the burn-scar check, and satellite pass prediction gives the date of the next pass when no clear image exists yet.
For background on the fire data itself, see NASA FIRMS active fire monitoring, and for other fire maps, best active fire maps. Terms are defined in the glossary.

Remote sensing specialist with 10+ years in satellite data processing and AI. Founder of Off-Nadir Lab. Ph.D. in Informatics (Yokohama National University, 2026). Master's in Earth System Science and Technology (Kyushu University). Co-author, Remote Sensing Encyclopedia. More about the author →