
What Is a Thermal Anomaly? Telling an Unusual Heat Source from a Routine Flare in Satellite Data
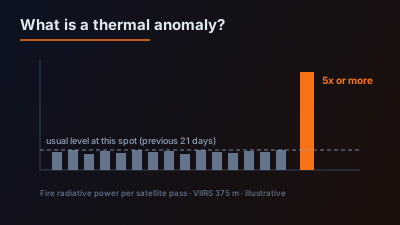
Quick Answer: A thermal anomaly is a satellite pixel flagged as containing a fire or another heat source. NASA FIRMS distributes them from VIIRS at 375 m within 3 hours of an observation, and does not say what kind of source each one is. At industrial sites most detections are routine: flares, furnaces, kilns. Two ways exist to deal with that. NASA's experimental Static Thermal Anomalies layer masks places that produced 5 or more detections in a year. Off-Nadir Delta compares each heat source with the same spot's own previous 21 days and keeps the ones at least 5 times stronger, tied to the facility they were near. Neither states a cause.
A satellite flags a hot pixel over a refinery. That could be the night the refinery was hit, or it could be the flare stack that burns every night. The detection is the same in both cases. This article explains what a thermal anomaly is, why detections at industrial sites are hard to read, and the two ways of separating the routine from the unusual.
What is a thermal anomaly in satellite data?
A thermal anomaly is a pixel that a satellite sensor flagged as much hotter than its surroundings at the moment it passed over. The term comes from the fire products themselves. NASA's FIRMS documentation puts it this way:
Each hotspot/active fire detection represents the center of a pixel flagged as containing one or more fires or other thermal anomalies (such as volcanoes).
The same documentation is direct about what the point on the map is not. The location is the centre of the pixel, "not necessarily the coordinates of the actual fire", and "the fire is often less than the size of the pixel". For VIIRS the pixel is approximately 375 m, and for MODIS approximately 1 km.
So a thermal anomaly is a measurement with three parts: a time, a place accurate to a few hundred metres, and a strength. It carries no description of what was burning.
What produces thermal anomalies besides wildfires?
Most detections are vegetation fires, but not all. NASA states that "in most cases hotspots/fires are vegetation fires, but sometimes a hotspot/fire is a volcanic eruption or the flare from a gas well."
FIRMS has a name for the non-fire group. It defines a Static Thermal Anomaly as:
a contiguous - sometimes persistent - cluster of thermal anomalies that are not considered to be vegetation fires. These can include petrochemical and cement production, gas flares and volcanoes.
That list is the practical one for anyone watching infrastructure. Refineries flare, cement kilns run hot, and gas fields burn off what they cannot pipe. All of these show up in the same product, with the same symbol, as a forest fire.
Why is a detection at an industrial site hard to read?
Because the data do not say which kind of source it is. NASA is explicit: "Different types of thermal anomalies are not currently attributed in the NRT MODIS or VIIRS data." A near-real-time detection over a refinery is a hot pixel and nothing else.
Two readings are both wrong. Treating every detection at a facility as an incident produces false alarms, because many facilities are hot on ordinary nights. Ignoring detections at facilities, because they are always there, throws away the one night that mattered.
The useful question is not "is there heat at this refinery?" The answer to that is usually yes. The useful question is "is there more heat than this place normally produces?"
How does NASA FIRMS separate static heat sources?
FIRMS offers an experimental layer that marks where routine heat is. According to the FIRMS FAQ, the Static Thermal Anomalies mask is built from one year of data:
- It uses 375 m Suomi NPP VIIRS active fire detections for calendar year 2023.
- Detection centroids are summarized on a 400 m grid.
- Each grid cell with 5 or more detections over the year goes into the mask.
- The mask is then filtered with industrial and power plant location datasets, to limit it to areas not associated with vegetation fires.
A companion layer shows the detections that intersect or sit next to the masked areas for the dates a user selects.
Two things about this layer matter for how it can be used. FIRMS lists static thermal anomalies under its experimental products. Asked whether the layer can be downloaded, it answers that the data "are provided for reference purposes only and should be used with caution" and that the layer "is not available for distribution". It is something to look at on the FIRMS map, not a dataset to build on.
The mask answers "where is heat routine?" It does not answer "is tonight unusual at this place?" A refinery inside the mask is marked the same on an ordinary night and on the night of a fire.
How can a heat source be compared with its own past?
By using the same location's recent detections as the baseline. If a spot has been producing 2 MW every clear night and tonight it produces 20 MW, that is a change, whatever the facility is. If a spot has been producing 20 MW every night, tonight's 20 MW is not.
This is the test Off-Nadir Delta applies before it records a thermal anomaly. A detection near a registered facility is kept when all of these hold:
- Its fire radiative power is at least 10 MW.
- It is within 2 km of a facility in the registry, such as a refinery, power plant, port or dam. Airports are excluded.
- It is at least 5 times the strongest detection within 500 m of the same spot in the 21 days before, or nothing was detected there in that time.
The two approaches differ in what they are for:
| Static mask (NASA FIRMS) | Own-baseline comparison (Off-Nadir Delta) | |
|---|---|---|
| Question answered | Where is heat routine? | Is this stronger than usual here? |
| Reference | One year of detections (2023) | The 21 days before the detection |
| Unit | 400 m grid cell | 500 m around the hot pixel |
| A steady flare | Marked as static | Filtered out by its own history |
| A flare that suddenly grows | Still marked as static | Kept as an anomaly |
| Availability | View only, experimental | Recorded as events, on a map and over an API |
A second kind of record covers places with no facility at all: a compact night-time heat source of at least 20 MW that stands out from its own past and from its surroundings. That kind does not rule out vegetation fires, and the record says so.
How often do the satellites look?
A few times a day, at fixed local times. NASA states that the 3,040 km VIIRS swath gives "full global coverage every 12 hours". Suomi NPP crosses the Equator at approximately 1:30 p.m. and 1:30 a.m. mean local time, with NOAA-20 and NOAA-21 about 50 minutes ahead at approximately 12:40, and mid-latitudes get 3 to 4 looks a day.
Detections are published quickly. FIRMS makes its near-real-time data available "within 3 hours of a satellite observation (on a best-effort basis)".
The consequence is a floor on what can be known. A fire that starts and is put out between two passes is never recorded. Near the Equator, an event at 4 p.m. local time is not seen until the passes after midnight, more than eight hours later, and only if it is still hot.
What does fire radiative power measure?
Fire radiative power is the strength figure attached to each detection. NASA defines it as "the rate of radiative energy emission per time unit from all fires within a pixel", and the VIIRS 375 m product reports it in megawatts.
It is a rate at one instant, summed over everything hot inside one pixel. Two small sources in the same pixel add up. NASA also notes that the actual pixel size varies with the scan and track position, so the same source is not sampled identically on every pass. That is one reason to read FRP as a ratio against the same spot's earlier level instead of as an absolute figure.
What can a thermal anomaly not tell you?
It cannot tell you the cause, and it cannot tell you that nothing happened. Both limits come from the data.
No cause. An attack, an accident, a maintenance flare, a process upset and a brush fire outside the fence all produce a hot pixel. Nothing in the measurement distinguishes them.
No exact location. The point is a pixel centre. A detection 300 m from a tank farm may be the tank farm, or the field next to it.
No guarantee of seeing. NASA lists the reasons a fire may be missed: it "may have started and ended between satellite observations", and "cloud cover, heavy smoke, or tree canopy may completely obscure a fire". Cloud also weakens a baseline. Three overcast weeks make a spot look quieter than it was, so the first clear night can look like a jump.
Confidence needs care. VIIRS confidence is low, nominal or high. NASA notes that the field "should be used with caution as it is likely that it will vary in terms of meaning in different parts of the world".
A thermal anomaly is therefore a reason to look, with a time and a place attached. It is not a finding on its own.
How do you check a thermal anomaly?
With sources that do not depend on the thermal sensor. There are two.
The first is reporting. If a facility was named in the news around the time of the detection, the report and the measurement support each other without either deriving from the other. Off-Nadir Delta lists reported events that name the same facility within 3 days of a detection, and keeps the two kinds of evidence labelled separately.
The second is imagery. A fire can leave a burn scar that optical imagery shows afterwards, and radar can show structural change through cloud. The method for bracketing a fire between a thermal detection and a burn scar is covered in Was There a Fire, and When?, and a routine for watching one site over time is in How to Keep Watch on a Facility with Free Satellite Imagery.
Where can thermal anomalies be seen?
Every raw detection is on the live active fire map, with no login. That is the place to check what the sensor saw on a given day.
The filtered records, the ones far above their own recent level, are on the Watchfloor as flame marks next to reported events, and described in full on the Thermal Anomalies page. Each record gives the strength, the earlier level at the same spot, the satellites and the facility. The same records are returned by GET /api/v1/thermal-anomalies, documented in the API reference. Which plan includes the measurement detail is on the Pricing page.
Summary
A thermal anomaly is a hot pixel with a time, a place and a strength. At industrial sites the hard part is not detecting heat but knowing whether it is unusual. NASA's experimental static mask marks where heat is routine. Comparing a heat source with its own previous weeks marks when it stops being routine. Either way the record states what was measured, and the cause has to come from somewhere else.
Heat detections: NASA FIRMS (LANCE), near-real-time VIIRS active fire data. A thermal detection is a measurement, not an assessment of cause or damage, and should be checked against other sources before it is acted on.

Remote sensing specialist with 10+ years in satellite data processing and AI. Founder of Off-Nadir Lab. Ph.D. in Informatics (Yokohama National University, 2026). Master's in Earth System Science and Technology (Kyushu University). Co-author, Remote Sensing Encyclopedia. More about the author →