
Quick answer — how to get started
Get started in minutes: 1) Sign up free, 2) Open the Watchfloor to see world events on one screen, 3) Ask Delta Agent what an event means, 4) On the Map, draw an area and search satellite imagery (Sentinel-1/2, NISAR, VIIRS), 5) Upload your data or add reference layers, 6) Compare layers and monitor change over time. No GIS experience needed.
Getting Started Guide
Learn how to use Off-Nadir Delta in just a few minutes: monitor world events on the Watchfloor, ask Delta Agent what they mean, and look closer with satellite imagery on the Map. This guide walks through that workflow step by step, in the order you would use it — and when you want the written assessment, Daily Reports has it ready.
No prior experience with GIS or satellite data is required. Follow along and you will be reading the world — from live events to satellite imagery — in no time.
Before you begin: accounts & tokens
Browsing the Watchfloor needs no account. Create a free account (no credit card) to chat with Delta Agent and save your work. Actions that load satellite imagery or run AI analysis use tokens — check your balance in the header anytime.
Step 1 · Watchfloor
Monitor world events on the Watchfloor
Your daily global situational picture — free to browse; without an account you see the previous day’s top events and every event on the map.
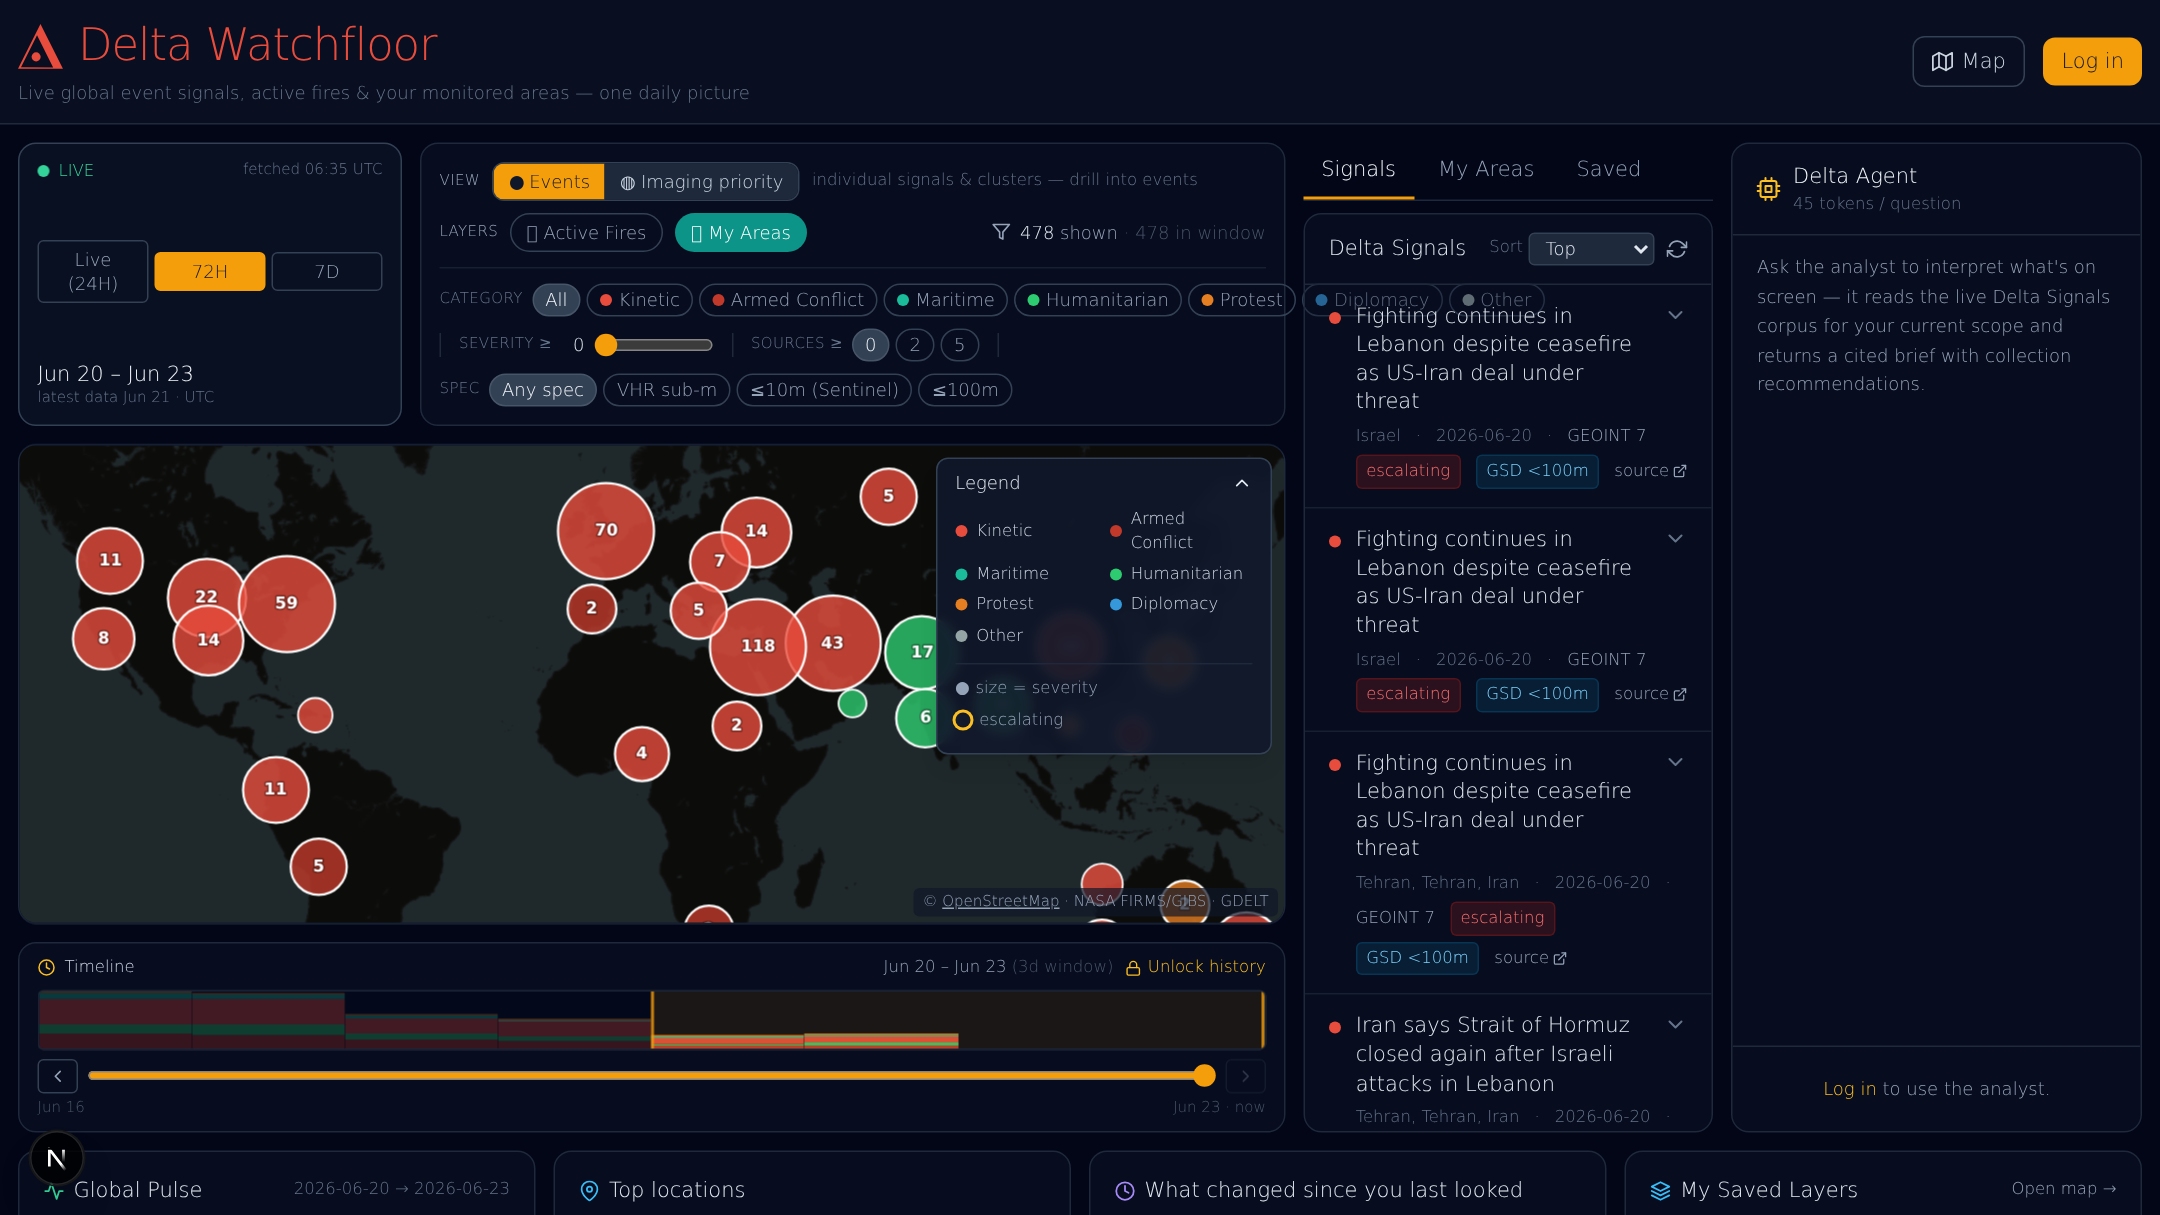
The Delta Watchfloor: geolocated world events on one map, with a timeline and a filterable list.
1Open the Watchfloor
- Open Watchfloor from the top navigation — without logging in you see the previous day’s top events and every event on the map; a free account opens every event and its details
- See the latest geolocated conflict, security, disaster and infrastructure events worldwide (Delta Signals, drawn from global news media and official hazard feeds)
2Scan and filter the signals
- Events appear on the map and in the list, newest reports first; the size of each dot shows its severity
- Filter by category on every plan; stage, severity, the number of outlets reporting and search on a paid plan
- Narrow by time: the last 24 hours, or on a paid plan the last 15 minutes, the last hour or a date range
3Open an event and keep watch
- Open any event for its summary, severity and where it stands; Starter shows the reported facts and places, and Pro the evidence behind them — every source, the collection recommendation and related events
- Watch an event, or the area on screen, to be told when something changes
Tip: Browsing the live global picture is free and needs no account — start here to find where to look today.
Step 2 · Delta Agent
Ask Delta Agent what it means
An AI intelligence analyst that returns sourced, geolocated briefs.
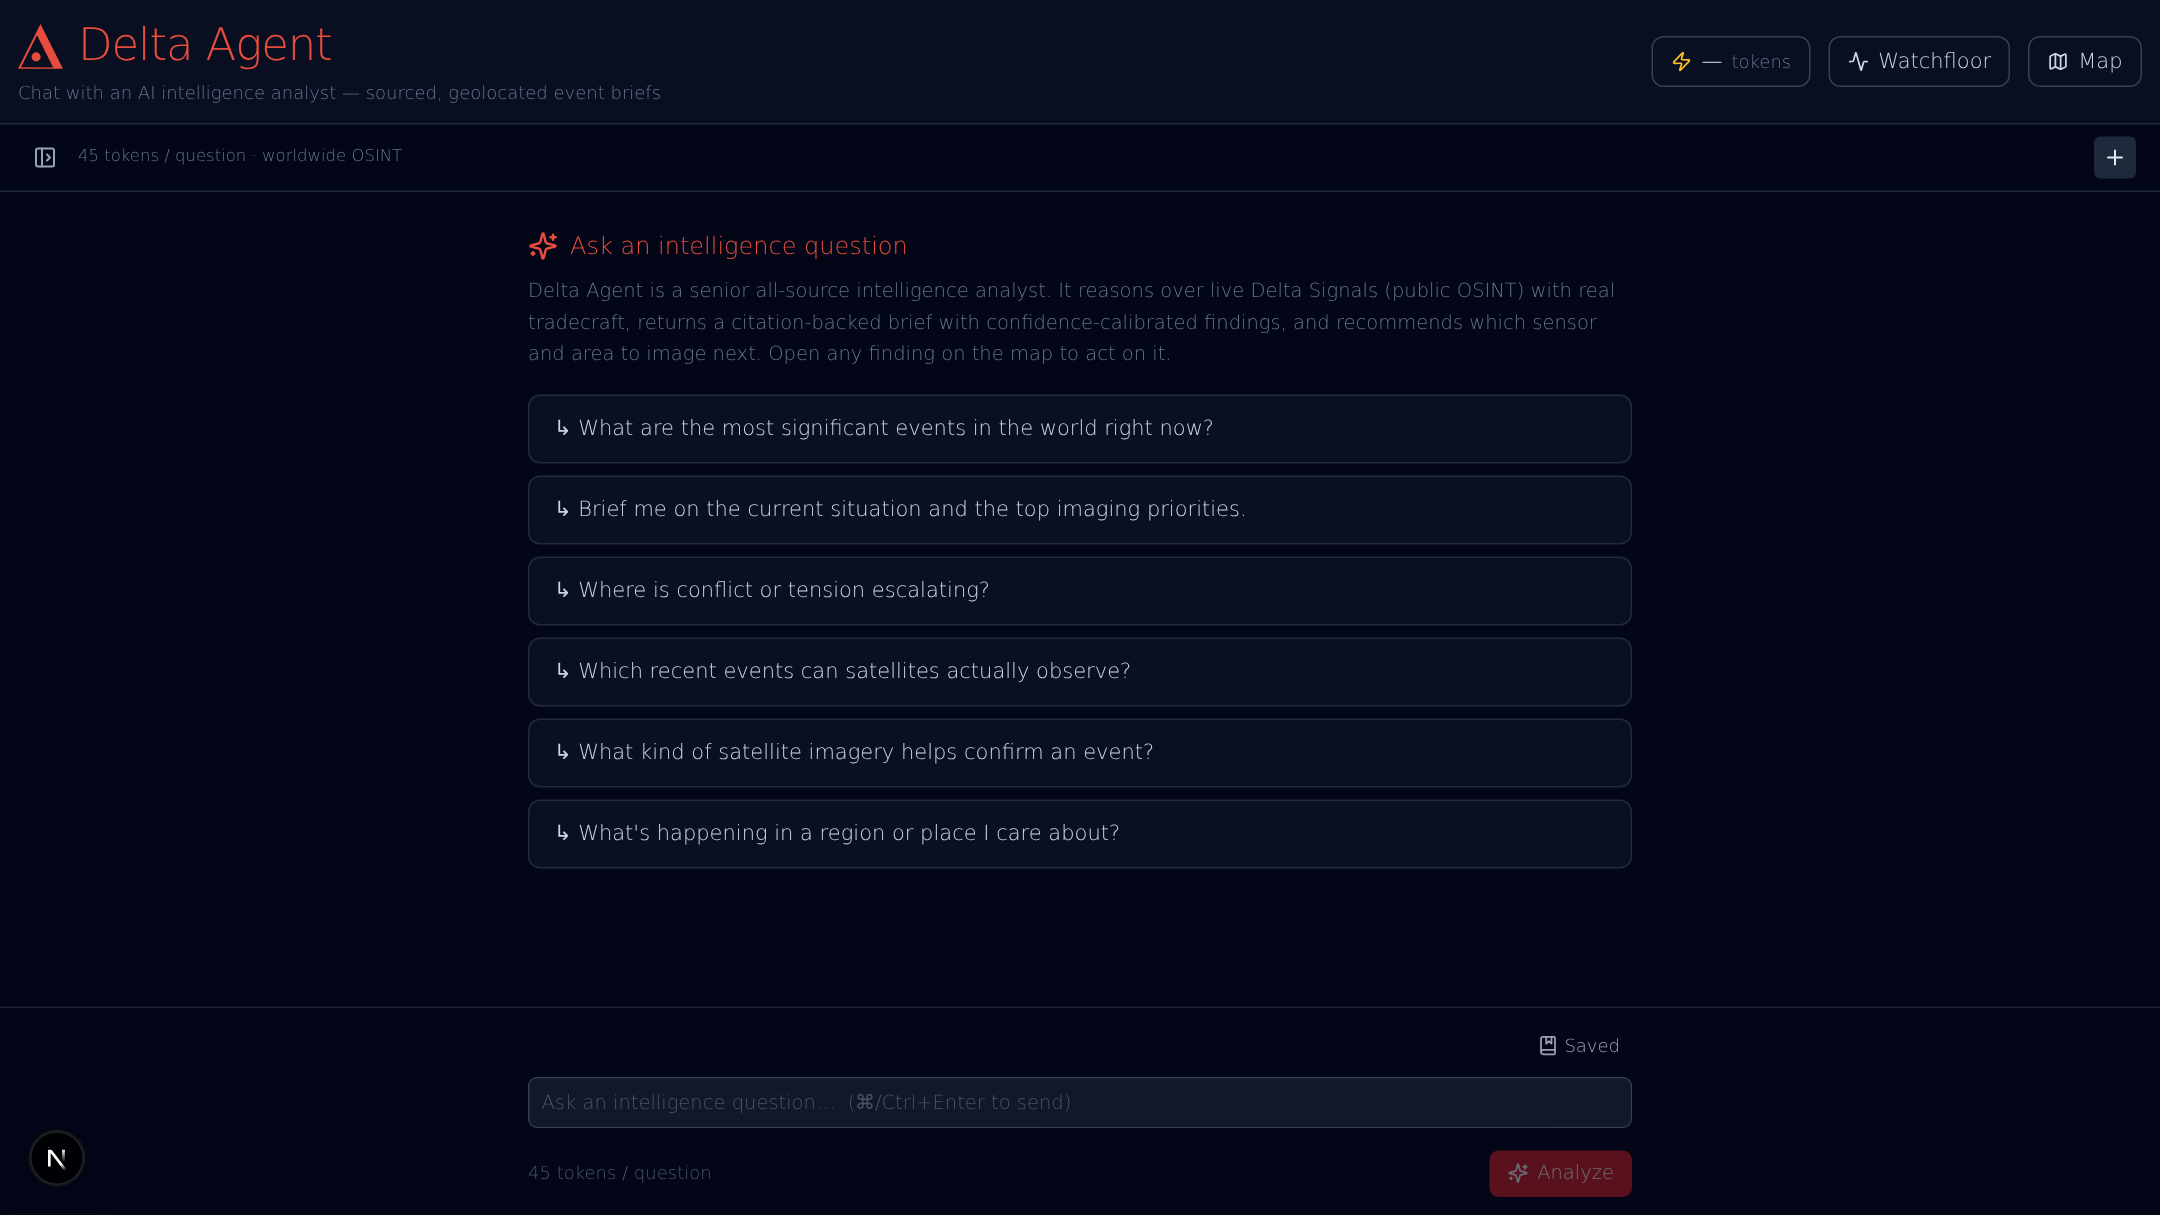
Delta Agent: ask in plain language, get a citation-backed intelligence brief.
1Ask a question in plain language
- Open Delta Agent and type a question — e.g. "What is escalating right now?" or "What is happening near a place I care about?"
- A free account is required to chat; each question draws from your token balance
2Read the sourced brief
- Delta Agent reasons over live events with real GEOINT/OSINT tradecraft
- You get geolocated findings with citations and confidence-calibrated language
- It recommends which sensor (SAR or optical) and which area to image next
3Act on a finding
- Every finding has a one-click action that opens it on the Map
- Display the recommended imagery, run a deeper assessment, or add it to your Watchlist
Tip: Not sure where to start? Ask Delta Agent for "the top imaging priorities right now".
Step 3 · Map
Look closer on the Map
A no-code satellite-imagery workbench — no GIS software, no API keys.
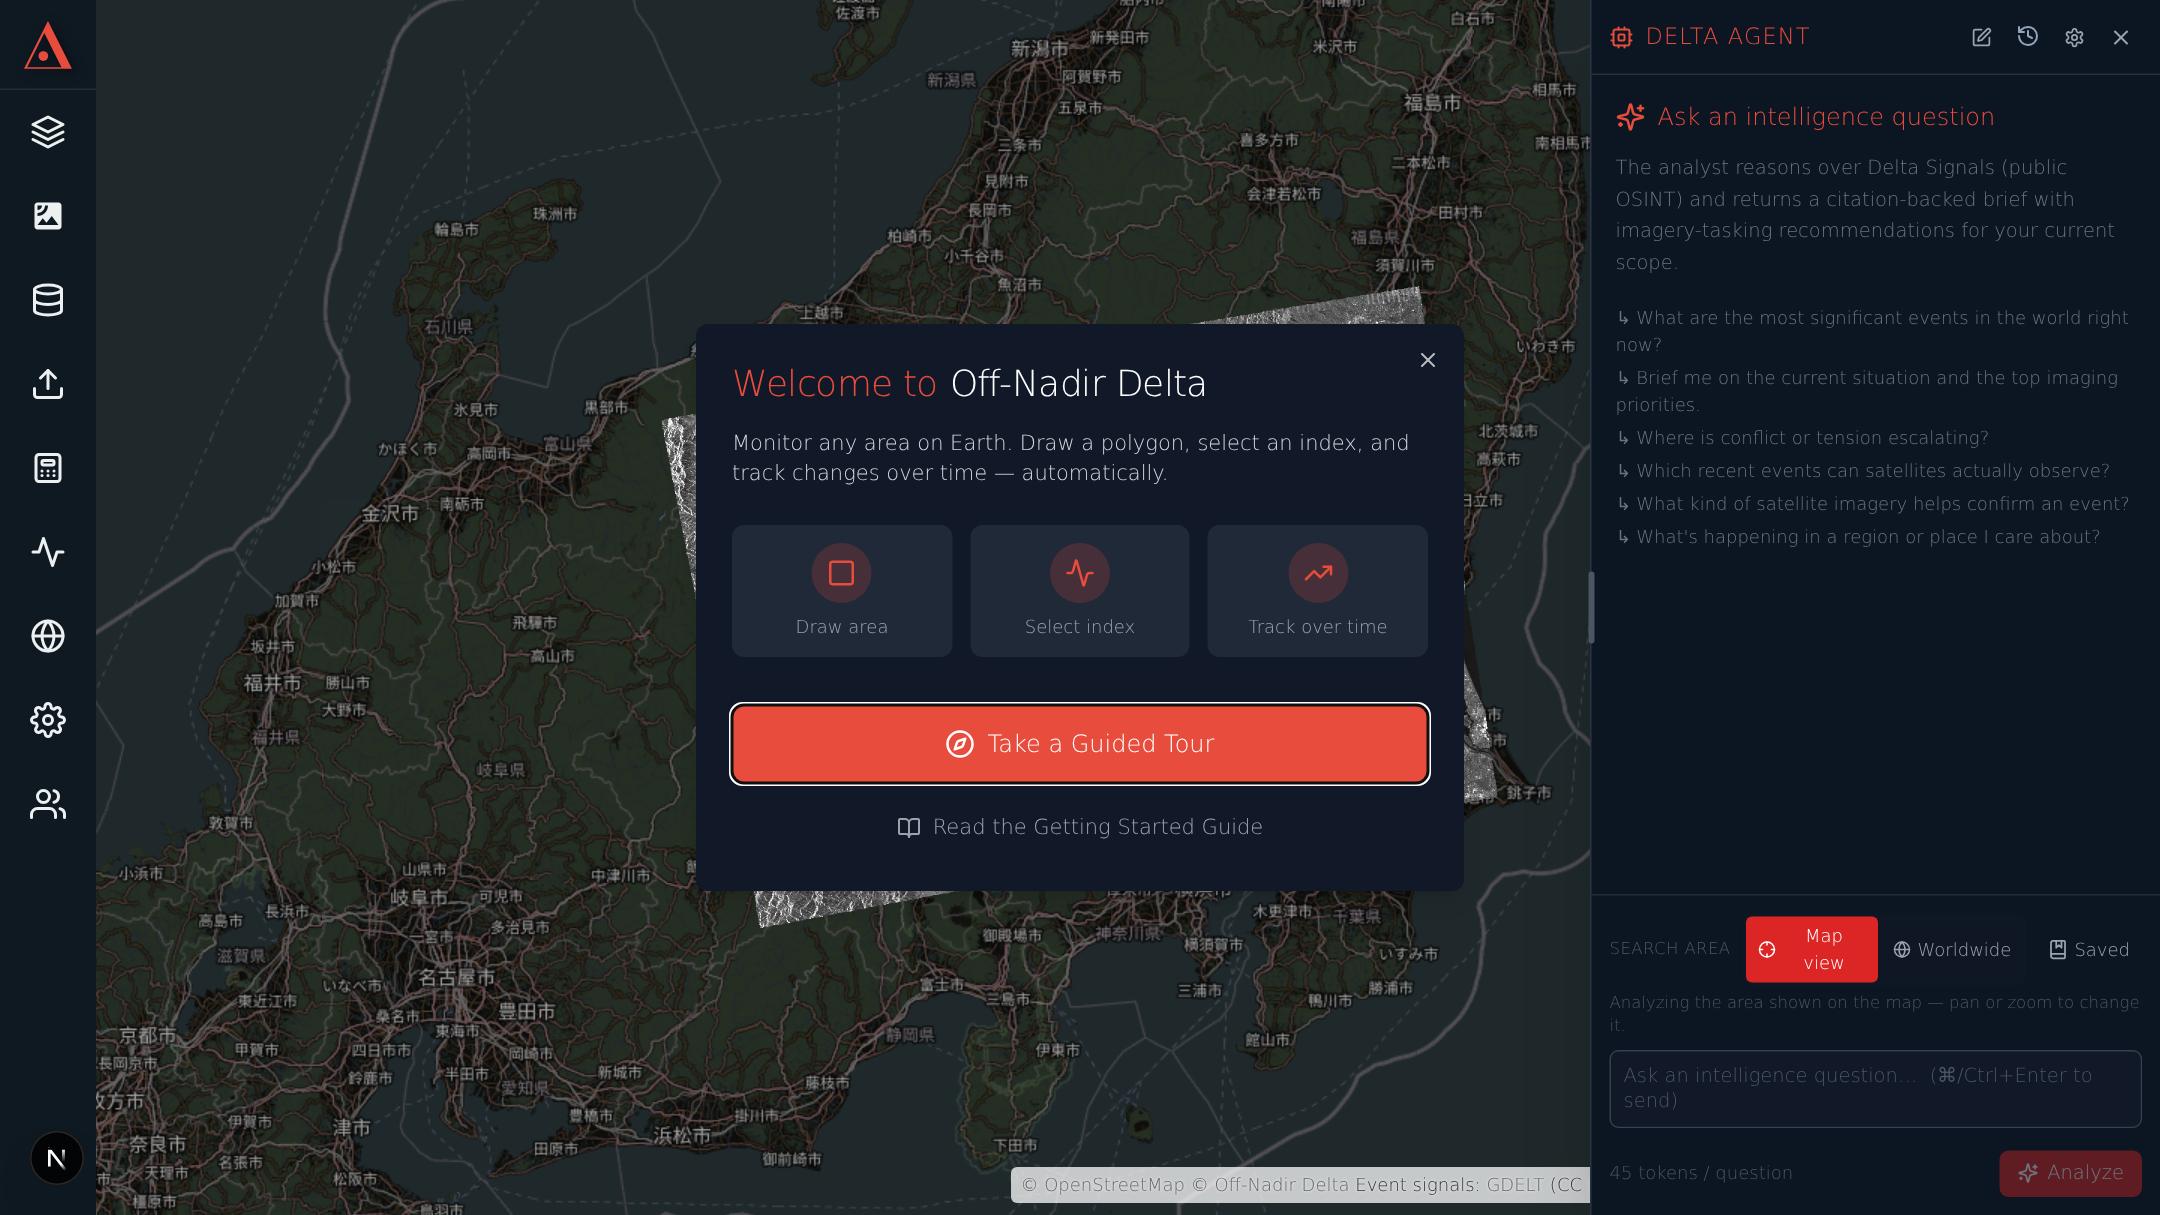
The Map: stack Sentinel-1 SAR, Sentinel-2 optical, NISAR L-band and VIIRS, then analyze.
1Search and add imagery
- Pan, zoom, or search for a location, then draw a bounding box for your area of interest
- Choose a source: Sentinel-1 (SAR), Sentinel-2 (optical), NISAR (L-band SAR, on plans that include it), or VIIRS (nighttime lights)
- Set a date range, search, and click a result to add the imagery to the map
2Visualize and compare
- Switch between True Color, False Color, and indices like NDVI in one click
- Stack images from different dates and adjust opacity to compare
- Upload your own GeoTIFF/GeoJSON and add reference layers for context
3Analyze
- Run change detection between two acquisitions to reveal exactly what changed
- Detect vessels in Sentinel-1 SAR — day or night, through cloud
- Monitor an area over time as a time series, measured on every pass, with robust anomaly detection
Tip: Start at a lower zoom level to preview an area before zooming in — this saves tokens.
Quick Reference: satellite sources
Which source to reach for on the Map, depending on what you need to see.
Sentinel-1 (SAR)
- • Works day and night
- • Sees through clouds and smoke
- • Best for: floods, disasters, vessels, ice
- • Grayscale radar imagery
Sentinel-2 (Optical)
- • Requires clear skies
- • Natural color and false color options
- • Best for: vegetation, agriculture, urban
- • 10 m resolution
VIIRS (Nighttime Lights)
- • Captures light emissions at night
- • Daily global coverage
- • Best for: urbanization, power outages, economic activity
- • ~500 m resolution
Ready to explore?
Create your free account and start reading the world — events, an AI analyst, and satellite imagery.
Get Started Free