
What Is a Transit Anomaly? Telling an Unusual Change in Ship Traffic at a Strait from Routine Variation
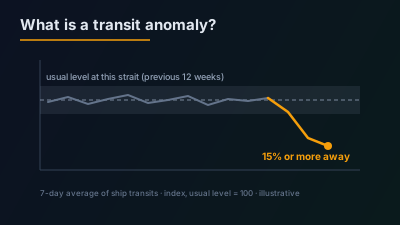
Quick Answer: A transit anomaly is a record that the number of ships passing a strait or canal left that place's own usual level. The counts come from AIS ship-tracking signals: IMF PortWatch publishes daily transit calls for 28 chokepoints and updates them weekly. A raw count says little, because weekdays, holidays, weather and gaps in AIS reception all move it. Off-Nadir Delta compares the 7-day average with the median of the 7-day averages over the 12 weeks before, and records an anomaly when the average is statistically unusual (a modified Z-score of 3.5 or more) and at least 15% away. A change shows up 4 to 11 days after it happens. The record never states a cause.
Fewer ships passed a strait last week than the week before. That could be a closure, or it could be a storm, a public holiday, or a week in which satellites heard fewer ship transmitters. The count is the same in every case. This article explains what a transit anomaly is, how ship transits are counted, and how to separate a change worth looking at from ordinary variation, without reading a cause into the number.
What is a transit anomaly?
A transit anomaly is a record that the number of ships passing a strait or canal has left that place's own usual level. It has four parts: a place, a period, a direction (fewer ships or more) and a size. It is a measurement of traffic, in the way a thermal anomaly is a measurement of heat. It is not a report that something happened, and it carries no explanation.
The places concerned are maritime chokepoints. The U.S. Energy Information Administration describes them this way:
Chokepoints are narrow channels along widely used global sea routes that are critical to global energy security.
The same article notes that "most chokepoints can be circumvented by using other routes—often adding significantly to transit time", while some "have no practical alternatives". That is why a change in the count at one of these places is worth knowing about, and also why it is easy to over-read.
How are ship transits counted?
From AIS, the Automatic Identification System that ships use to broadcast their identity and position. IMF PortWatch publishes daily counts for 28 chokepoints, and its dataset description states the source plainly: "We use real-time data on vessel movements—Automatic Identification System (AIS) signals of vessels—as our primary data source."
The unit is a transit call. The dataset defines it as follows:
a transit call is defined when a ship transits through the chokepoint boundary. Transits that span across several days are counted only once and a threshold of 48 hours is applied before counting the same ship again.
Three details in that description decide what the count means:
- Five ship categories are counted: container, dry bulk, general cargo, ro-ro and tanker. Warships, fishing vessels and passenger ships are not among them.
- Dates are in UTC, so a "day" at a strait is not the local calendar day.
- The boundary is drawn by the publisher. A ship is counted when it crosses a line on a map, and that line can be redrawn.
AIS itself is a self-reporting system. PortWatch's description says it "has been made compulsory for all international commercial ships with gross tonnage of 300 or more tons" and for all passenger ships. A ship that does not broadcast is not in the count.
Why does a raw ship count say so little?
Because every strait has its own normal, and that normal moves for reasons that are not disruptions. Some places are always busy and some are always quiet, so the number alone separates nothing. Even at one place, the daily count rises and falls with the days of the week.
The PortWatch FAQ lists several things that change its figures without any change in what is allowed to pass:
- Holidays. The timing of the Lunar New Year "in either January or February can also affect the estimates of maritime activity", especially for a group of East and Southeast Asian economies.
- Reception. There are occasional "blackout" days "when reporting is disrupted at the source". The FAQ names May 12, 2022, February 14, 2023 and January 9, 2024.
- Receiver coverage. In November 2021, "expanded receiver coverage led to a noticeable and sustained increase" in recorded transit traffic through the Malacca Strait. More ships were heard, which is not the same as more ships passing.
- Transponders switched off. AIS transponders "may be turned off, especially in conflict regions or ports in countries targeted by sanctions", which the FAQ says may affect traffic through the Red Sea.
- Interference. For the Strait of Hormuz the FAQ refers to "reports of GPS jamming, AIS spoofing, and vessels going dark".
Weather belongs on the same list, although PortWatch does not itemise it there. A count that falls is therefore a fact about the count first. Whether it is a fact about the strait is a second question.
How can a change be told apart from routine variation?
By comparing the place with its own recent past, and by asking two questions instead of one. Is the change large compared with how much this place normally moves? And is it large in plain terms? Off-Nadir Delta records a transit anomaly only when both answers are yes.
The rule, as it is applied to each of the 28 places:
- The value read is the 7-day average of ship transits. Seven days cover every day of the week once, which evens out the weekly rhythm.
- The usual level is the median of the 7-day averages over the 12 weeks before that.
- The average is outside its usual range when it is statistically unusual against those weeks, with a modified Z-score of 3.5 or more, and at least 15% away from the usual level.
- Places where both the current and the usual level are under 10 ships a day are not judged. A 15% change there is one or two ships.
The modified Z-score is the outlier measure proposed by Iglewicz and Hoaglin. It replaces the mean and standard deviation with the median and the median absolute deviation (MAD), so that one extreme week does not stretch the yardstick it is measured with. The NIST Engineering Statistics Handbook gives the formula, 0.6745 times the distance from the median divided by the MAD, and records the authors' recommendation that values above 3.5 in absolute terms "be labeled as potential outliers".
What does the rule look like with numbers?
Consider a hypothetical scenario: three straits that each usually see 60 ships a day, and each record a 7-day average below that. None of these figures comes from real data. They only show how the two conditions work together.
| Hypothetical strait | How much its weekly average normally moves (MAD) | This week's 7-day average | Change | Modified Z-score | Recorded? |
|---|---|---|---|---|---|
| Steady | 2 ships | 48 | −20% | 4.0 | Yes: unusual and 15% away |
| Very steady | 0.5 ships | 56 | −7% | 5.4 | No: unusual for this place, but under 15% |
| Erratic | 6 ships | 48 | −20% | 1.3 | No: 20% down, but within what this place does |
The second row is why a percentage floor is needed. At a place that barely varies, a small move is statistically striking and practically minor. The third row is why the statistical test is needed. At a place that swings widely, a 20% fall is an ordinary week.
In the first row, the level would be reported as an index of 80, with the usual level set to 100.
How late is a transit anomaly?
Days, not hours. PortWatch states that its chokepoint figures are "updated weekly, Tuesdays 9 AM ET". The records are built on measurements published on that weekly schedule, so in Off-Nadir Delta a change in ship traffic becomes visible 4 to 11 days after it happens.
Each level is dated with the last day it covers, and that day is not today. A transit anomaly is confirmation that a level has moved, arriving after the reporting. It is not an alert at the moment a strait is blocked.
Can the numbers change afterwards?
Yes. PortWatch says that "data revisions may occur for several reasons, including due to updates to the AIS source data, enhancements to the methodology, and changes in the coverage of ports and vessels", and recommends "using the latest series as the most reliable estimate".
Its Data and Methodology page keeps a log of such changes. Entries there include a boundary refinement for the Strait of Hormuz in March 2026, revisions in July 2026 following "stronger checks for AIS spoofing", and a drop in underlying AIS coverage that affected the Bosporus and parts of Southeast Asia from March to July 2024 and was backfilled in October 2024.
For anyone reading a transit anomaly this means a level first seen one week may be a different figure the next. Off-Nadir Delta marks a level as revised when the figure behind it changed after it was first recorded.
What can a transit anomaly not tell you?
It cannot tell you why, and it cannot tell you what is allowed to pass. Both limits come from what is being counted.
No cause. Weather, holidays, a closure, an attack and re-routing all change the number. So do the reception and coverage effects listed above. Nothing in a count distinguishes them.
Not open or closed. A record says fewer or more ships crossed a line. Ships may be waiting, diverted or choosing not to sail. A strait can be legally open and nearly empty.
Not every vessel. Ships that do not broadcast are not counted, and neither are vessel types outside the five categories. A fall in the count can mean fewer ships, or the same ships with transmitters off.
Not today. The measurements are updated weekly.
Not cargo. A count of ships is not a volume of oil or goods. Ships differ in size and in how full they are.
Are tankers and container ships looked at separately?
Yes, because the total can hide a change in one kind of ship. The same rule is applied to tankers alone and to container ships alone. A tanker-only or container-ship-only anomaly is recorded when the total is not already outside its usual range in the same direction, so one change does not produce two records.
One continuing move also makes one record. While traffic stays outside its usual range in the same direction, no new record is made. A new one starts when the direction changes, or after 14 quiet days.
How do you check a transit anomaly?
With sources that do not depend on the count. There are two.
The first is reporting. A closure, an attack or a storm at a strait can be reported within hours, well before weekly figures show it. If reporting names the place in the same period, the report and the measurement support each other without either deriving from the other. If nothing was reported, the reception and holiday explanations deserve a look before any other.
The second is imagery. Radar satellites image ships whether or not they broadcast, which addresses the largest blind spot in an AIS count. How that works is covered in Maritime Vessel Detection from Satellite SAR and Optical Imagery.
Where can transit anomalies be seen?
On the Watchfloor map, next to reported events. All 28 measured straits and canals are marked while the Transit anomalies layer is on: faint when within the usual range, amber when outside it. Each place has a card with its current level, its 7-day trend against the usual level, and the definition of "usual". The full description is on the Transit Anomalies page, and the term is in the glossary.
GET /api/v1/transit-anomalies, documented in the API reference, returns every measured place with its status and its level as an index, with the usual level set to 100. It does not return ship counts. Off-Nadir Delta does not provide the underlying daily measurements; it keeps its own record of the anomalies derived from them. Which plan includes the numbers is on the Pricing page.
Heat sources are recorded on the same principle, a place compared with its own past. That is described in What Is a Thermal Anomaly? and on the Thermal Anomalies page.
Summary
A transit anomaly is a count of ships through a strait or canal that has left that place's own usual level. The hard part is not counting but knowing what is ordinary: weekdays, holidays, weather and AIS reception all move the number. Comparing a 7-day average with the previous 12 weeks, and requiring the change to be both statistically unusual and at least 15%, removes most of the routine. What is left states where, when and by how much. The cause has to come from somewhere else.
Sources: UN Global Platform; IMF PortWatch (portwatch.imf.org)
A transit anomaly is a measurement, not an assessment of cause, and should be checked against other sources before it is acted on.

Remote sensing specialist with 10+ years in satellite data processing and AI. Founder of Off-Nadir Lab. Ph.D. in Informatics (Yokohama National University, 2026). Master's in Earth System Science and Technology (Kyushu University). Co-author, Remote Sensing Encyclopedia. More about the author →