
Night Lights, SO2, Earthquakes and Cyclones: Four Measured Events and What Each One Can and Cannot Tell You
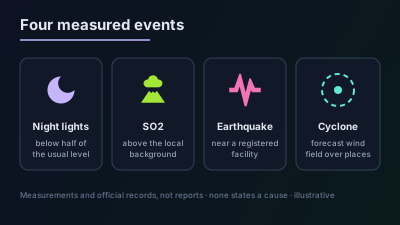
Quick Answer: A measured event is a record made from an instrument or an official record, not from a news report. Off-Nadir Delta records four such kinds besides thermal and transit anomalies. A night-light anomaly: a listed city's satellite-measured night lights (NASA Black Marble) below half of its own usual level on a night when at least 70% of the city could be observed. An SO2 anomaly: Sentinel-5P sulfur dioxide clearly above the local background around a volcano with a current ash advisory. An earthquake near facilities: a USGS earthquake record with a registered facility within 25, 50 or 100 km depending on magnitude. Cyclone wind exposure: registered facilities and straits inside the 34-knot wind radii of a National Hurricane Center forecast advisory, within 48 hours. None of them states a cause, a size or damage.
A news report tells you what someone said happened. An instrument tells you what it registered, whether or not anyone wrote about it. The two fail in different ways, which is the reason to keep both. This article describes four kinds of event that Off-Nadir Delta builds from instruments and official records, the rule behind each, and the questions each one leaves open.
What is a measured event?
A measured event is a record made from a measurement or an official record instead of from reporting. It has no publisher and no headline written by a journalist. Its title and summary are produced by a fixed rule from the recorded values, and it never states a cause. Off-Nadir Delta already records two kinds, thermal anomalies and transit anomalies. The four below follow the same idea.
Only two of the four are measurements in the strict sense. A night-light anomaly and an SO2 anomaly come from satellite data that Off-Nadir Delta processes. An earthquake near facilities is a seismic record from the U.S. Geological Survey combined with distances. Cyclone wind exposure is an official forecast laid over a list of places. The difference matters when you read them, so each is labelled for what it is.
| Kind | Made from | The rule in one line | What it leaves open |
|---|---|---|---|
| Night-light anomaly | NASA Black Marble night lights | A listed city below half of its own usual level, with at least 70% of the city observed | Why the light fell |
| SO2 anomaly | Sentinel-5P sulfur dioxide | Gas near a volcano with a current ash advisory clearly above the surrounding ring | Eruption size, plume height, ash |
| Earthquake near facilities | USGS earthquake records | A registered facility within 25, 50 or 100 km of the epicentre, by magnitude | Shaking and damage |
| Cyclone wind exposure | National Hurricane Center forecast advisories | Registered places inside the 34-knot wind radii, now or within 48 hours | Whether the wind arrives |
What does a night-light anomaly record?
A night-light anomaly records that the satellite-measured night lights over a city were below half of that city's own usual level on one night. A night is judged only when at least 70% of the city's area could be observed, and the usual level is the median of at least 5 recent earlier nights that met the same condition. It is a statement about measured light and nothing else.
The data is NASA's Black Marble product suite. NASA Earthdata describes its source as "the VIIRS Day/Night Band (DNB), a specialized sensor with variable gain settings designed to capture low-light imagery of Earth at night", and says of the processing:
Complex algorithms correct for atmospheric, terrain, lunar bidirectional reflectance distribution function (BRDF), and stray light effects to generate an Earth surface radiance measure.
The daily product used here is VJ146A2, from the NOAA-20 satellite, on a 500 m grid.
Those corrections are the reason the rule is cautious. A correction leaves a residue, and the residue is largest where the signal is smallest. So a night under cloud is not judged at all, a city whose usual level is very dim is measured but never flagged, and only a fixed list of cities is covered. Recent nights come from the near-real-time product and are marked provisional, because the value can change when the standard product for the same night arrives about nine days later.
What the record cannot say is why. A power cut, an evacuation or damage lowers the measured light. So does leftover error from cloud, smoke or the correction for moonlight. The record does not tell these apart, and it should not be read as a confirmed blackout. A night with no record was not necessarily normal either: it may simply not have been observable.
What does an SO2 anomaly record?
An SO2 anomaly records that Sentinel-5P measured sulfur dioxide clearly above the local background around a volcano on one day. Only volcanoes with a volcanic ash advisory in the previous 3 days are checked. The pixels within 0.5 degrees of the volcano are compared with the ring around them out to 2 degrees, in the same overpass.
Sentinel-5P carries the TROPOMI instrument. The Copernicus Data Space describes its output as "daily global observations" that include the total column of sulfur dioxide, and the mission page gives the launch date as 13 October 2017.
The comparison is local on purpose. The noise in the measurement differs from region to region, so a fixed amount of gas is a poor test. A record is made when at least 10 nearby pixels are more than 5 times the ring's spread above its median and above 1 Dobson Unit, and that count is at least 3 times what the ring's own rate would predict.
The test can still be met by noise. In checks on three days (2026-10-04 to 2026-10-06), it was met at about 1% of random places with no volcano. Three days do not show how that rate changes with season or latitude.
An SO2 anomaly is a second line of evidence next to an ash advisory, from a source that does not depend on it. It does not give the size of an eruption, the height of a plume or whether ash was present. Sulfur dioxide also comes from smelters and power plants. No record on a given day does not mean the volcano was quiet, since cloud, viewing geometry and weak emission hide the gas.
The data is used under the legal notice on the use of Copernicus Sentinel data, which asks for the notice "Contains modified Copernicus Sentinel data" when the data has been modified.
What does an earthquake near facilities record?
An earthquake near facilities is a U.S. Geological Survey earthquake record that has a registered facility close to its epicentre. The distance searched depends on magnitude: 25 km for magnitude 5.0 or more, 50 km for 5.5 or more, 100 km for 6.5 or more. Earthquakes deeper than 70 km, and earthquakes whose depth is not given, are left out.
The source is the USGS earthquake feeds, which the USGS feed documentation marks as "Updated every minute". Earthquakes that USGS itself rates as significant are already ordinary events on the map. This kind is for the moderate ones below that line that happen next to a port, an airport, a base, an energy or nuclear site, a dam or a bridge.
The record lists up to the 5 nearest registered facilities with the distance from the epicentre to each facility's registered point. That distance is a fact. Everything after it is not in the record: it does not say how strongly any facility was shaken, or that it was damaged or stopped. The distance bands decide what counts as near. They are not a model of ground motion.
What does cyclone wind exposure record?
Cyclone wind exposure records which registered facilities and straits lie inside the 34-knot (tropical-storm-force) wind radii of a U.S. National Hurricane Center forecast advisory, at the storm's current position or at a forecast position within 48 hours. There is one record per storm, updated with each advisory. It covers the Atlantic, the eastern Pacific and the central Pacific.
The National Hurricane Center issues its Forecast/Advisory "every six hours at 0300, 0900, 1500, and 2100 UTC", and describes the content this record relies on:
It also includes the current maximum radial extent of 4-meter seas, as well as the maximum radial extent of winds of 34, 50, and 64 kt in each of four quadrants around the storm.
The word "maximum" is the limit of the record. A radius is the farthest the wind is expected to reach anywhere in its quadrant, so a place inside it will not necessarily have 34-knot winds. Forecast positions carry track error, and positions later than 48 hours are not used for that reason. A storm over open water with no registered facility or strait inside its radii produces no record.
Two more limits belong here. Typhoons in the western Pacific and cyclones in the Indian Ocean are not covered, so the absence of a record there says nothing. And the record is not an official forecast or warning. National Weather Service information is in the public domain on the condition, among others, that it is not modified and then presented "as official government material" (NWS disclaimer). For the forecast itself, read the National Hurricane Center.
How should a measured event be read next to a news report?
As a different kind of evidence, not as a stronger one. A measured event is precise about what was registered and silent about what it means. A report is the reverse. On the Delta Watchfloor each of the four kinds has its own mark and its own category, and none is merged into a reported event about the same place.
Three habits follow from the rules above:
- Read absence carefully. A cloudy night, a volcano without an advisory, an unregistered facility and a storm outside the covered oceans all produce no record. No record is not a finding.
- Do not supply the cause. The record of a dim city does not say outage. The record of gas over a volcano does not say eruption. Cause comes from reporting and imagery.
- Treat an empty severity as not assessed. These four kinds carry no severity. An empty value does not mean minor.
Consider a hypothetical scenario: a night-light anomaly appears for a city, and no report mentions it. The honest reading is that the city was much dimmer than usual from orbit on that night, in the part that could be seen. It is a reason to look for reporting and for a second night, not a conclusion.
Where do these records appear?
On the Watchfloor map, under the categories Night-Light Anomalies, SO2 Anomalies, Earthquakes Near Facilities and Cyclone Wind Exposure. Every plan sees that a record exists, its kind, when, and where. Which city, volcano, facilities or storm a record is about, and its values, are part of the full account of each event; the Pricing page shows which plan opens it.
The same records are events over the API, selected by category, and the API reference lists the endpoints. Each page linked in the table above gives the full rule, the source credit and the limits for its kind. For the terms themselves, see the glossary.

Remote sensing specialist with 10+ years in satellite data processing and AI. Founder of Off-Nadir Lab. Ph.D. in Informatics (Yokohama National University, 2026). Master's in Earth System Science and Technology (Kyushu University). Co-author, Remote Sensing Encyclopedia. More about the author →
Related Articles
What Is a Transit Anomaly? Telling an Unusual Change in Ship Traffic at a Strait from Routine Variation
Oct 7, 2026
What Is a Thermal Anomaly? Telling an Unusual Heat Source from a Routine Flare in Satellite Data
Oct 6, 2026
Was There a Fire, and When? Confirming and Dating a Reported Fire with Satellite Data
Oct 4, 2026