
How to Keep Watch on a Facility with Free Satellite Imagery
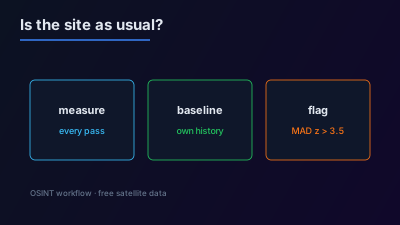
Quick Answer: Watching a facility with free satellite imagery means measuring the same thing on every new pass and comparing it with the site's own history. Pick one measurable quantity that reflects whether the site is working as usual, such as ships alongside a berth in Sentinel-1 radar or a burn or water index in Sentinel-2, build a baseline from past passes, and flag readings that depart from it. Sentinel-1 repeats every 12 days per satellite and Sentinel-2 revisits every 5 days at the Equator, so a free watch notices changes over days, not hours.
A single satellite image answers what a place looked like on one day. A watch answers a different question: is this place behaving as it usually does? Free Sentinel imagery is well suited to that question, because the satellites return on a fixed schedule and every pass can be measured the same way. This guide explains how to set up a watch on a facility that produces a signal rather than a pile of images.
What does it mean to watch a facility by satellite?
Watching a facility means reducing each new image to one number, recording it, and comparing it with the numbers from earlier passes. The number might be how many large ships are alongside, how bright the site is at night, or how much of the surrounding land is burned or flooded. The image is the raw material; the series of numbers is the product.
This matters because looking at images one by one does not scale and is easy to misjudge. A port with five ships looks busy or quiet depending on what the viewer expects. A series shows that five is ordinary for that port, or that it has never been below twelve before.
A watch therefore needs three decisions: where exactly, what to measure, and what counts as unusual.
Which free satellites can a watch rely on?
A watch depends on satellites that return on schedule and cost nothing per image. Two Copernicus missions fit, and they complement each other.
| Mission | What it measures | Repeat | Cloud and night |
|---|---|---|---|
| Sentinel-1 | C-band radar backscatter, sensitive to metal, structure and surface roughness | 12-day repeat cycle for one satellite, six days for two | Images day and night regardless of the weather |
| Sentinel-2 | Reflected light in 13 bands, four of them at 10 m | Designed for a revisit of 5 days at the Equator | Needs daylight and clear sky |
Both are free: Copernicus states that Sentinel data products are made available free of charge to all users.
The repeat interval sets what a free watch can notice. A change that lasts a few hours between passes is invisible. A change that persists for days, such as an emptied anchorage, a burned compound or a new earthwork, is caught at the next pass. For the date of that pass, see satellite pass prediction.
Radar is the more dependable basis for a watch, because cloud does not interrupt the series. An optical series over a cloudy region has gaps, and a gap is not a reading of zero.
What should you measure at each kind of facility?
Measure the one quantity that reflects whether the site is doing its job. A watch that tracks something unrelated to the site's function produces numbers and no meaning.
| Facility | The question | A measurable sign in free imagery |
|---|---|---|
| Port or anchorage | Is it handling ships as usual? | Number of large vessels detected in Sentinel-1 radar |
| Airfield or base | Have structures or surfaces changed? | Radar backscatter over the site; new bright or dark areas |
| Industrial plant or depot | Has it burned or been damaged? | Burn index from Sentinel-2; fire detections on the day |
| Dam, reservoir or river crossing | Has the water extent changed? | Water index from Sentinel-2; dark area in radar |
| Farmland or forest around a site | Has vegetation been cleared or burned? | Vegetation index from Sentinel-2 |
Keep the area tight. A box drawn around the berths measures the berths. A box around the whole bay also counts ships passing through, and the series becomes noise. The limits on what each sensor can resolve are in what you can actually see in 10 m satellite imagery.
For indices and what each one responds to, see how to choose the right satellite index for your monitoring goal.
Why does a baseline matter more than any single reading?
A reading has meaning only against the site's own history. Twelve ships is a quiet day at one port and a record at another. The baseline is the set of earlier readings for the same place, measured the same way, and "unusual" is defined as a departure from it.
Two practices make a baseline trustworthy:
- Hold the method constant. Same area, same sensor, same measurement. For Sentinel-1, the same orbit direction, because ascending and descending passes view the site from opposite sides. See ascending vs descending SAR orbits.
- Collect enough history before judging. A first reading has nothing to be compared with. Past passes can be measured to fill in the history, since the archive is free.
Seasonality belongs in the baseline too. Vegetation, water levels and even shipping follow annual cycles, so a reading should be compared with the same season, not only with last week.
How are unusual readings flagged?
An unusual reading is one that sits far from the centre of the site's recent readings, measured in units of their typical spread. The usual textbook method uses the mean and standard deviation, but both are pulled around by the very outliers the method is trying to find.
A more robust approach uses the median and the median absolute deviation (MAD), which a single extreme value barely moves. The NIST Engineering Statistics Handbook describes the modified z-score built on them and notes that Iglewicz and Hoaglin "recommend that modified Z-scores with an absolute value of greater than 3.5 be labeled as potential outliers".
Off-Nadir Delta's Watchlist uses this approach: a new measurement is flagged when its MAD-based modified z-score exceeds 3.5 against the area's own recent measurements, and no flag is raised until there are at least 5 earlier measurements to compare with.
A flag is a prompt to look, not a finding. Open the image behind the reading and check the ordinary explanations first: cloud over an optical scene, a different orbit direction, rough sea affecting ship detection, a seasonal change. The verification steps are in how to verify a reported event with free satellite imagery.
How do reported events fit alongside the measurements?
Imagery shows that something changed; reporting often says what. A complete watch on a facility keeps both: the measured series, and the news and official notices that mention the place. An attack, an accident, a closure or a strike explains a change in the series, and a change in the series can show that a report was accurate.
The two must stay distinguishable. A report that names the facility is stronger than one that merely happened nearby, and neither is the same as a measured change. Off-Nadir Delta's Watchlist keeps that distinction when it links events to a watched site: each link records whether the reporting named the place or was only located close to it.
How is this done in Off-Nadir Delta?
The Delta Watchlist implements the workflow above without GIS software. There are three kinds of watch, each with its own tab:
- Areas. Draw an area, pick what to measure, and each new Sentinel-1, Sentinel-2, NISAR or VIIRS acquisition over it is measured automatically into a time series.
- Sites. Pick a port, airport or base from the facility registry, or place a point anywhere, and choose a scale: facility, city or country. A facility-scale watch on a port measures ships by default; country scale follows reporting only.
- Events. Follow a specific world event as its reporting develops.
Changes can be sent by email, and watch notifications can also be posted to a Slack or Discord channel connected in account settings. Watches are readable and configurable over the REST API and MCP server as well, described in the developer documentation.
An overview of the monitoring concept is at satellite area monitoring, and a longer treatment of time series is in how to monitor any area with satellite time series.
What can a satellite watch not tell you?
A free satellite watch cannot see between passes, cannot see small things, and cannot say why. Those three limits should be written into any conclusion drawn from it.
- Between passes. With a repeat of several days, a ship that arrived and left is never counted. A series is a set of samples, not a continuous record.
- Small things. At 10 m, vehicles and people are not visible, and small boats are often missed.
- Why. A drop in ship count is consistent with a closure, a holiday, bad weather or a strike. The measurement narrows the question; it does not answer it.
A watch earns its place by telling an analyst when to look closely, and by providing a record of what normal looked like before something changed.

Remote sensing specialist with 10+ years in satellite data processing and AI. Founder of Off-Nadir Lab. Ph.D. in Informatics (Yokohama National University, 2026). Master's in Earth System Science and Technology (Kyushu University). Co-author, Remote Sensing Encyclopedia. More about the author →