
Rapid Damage Mapping: The Satellite Workflow from Disaster to Decision
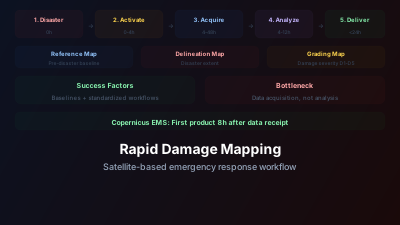
Quick Answer: Rapid damage mapping follows a standardized workflow: disaster occurs → activation request (hours) → satellite tasking (hours) → data acquisition (hours-days) → analysis (hours) → product delivery (typically within about 24 hours of activation). The Copernicus EMS works to published target delivery times measured in hours from image reception for its fastest rush products — vector data first and the cartographic map about two hours later — with more detailed products following over the next days. Products include reference maps, delineation maps (disaster extent), and grading maps (damage severity). Key success factors: pre-positioned archive data for baseline comparison, automated processing pipelines, and standardized cartographic products that field responders can read immediately. The bottleneck is usually data acquisition (waiting for a satellite pass with suitable geometry and weather), not analysis.
Satellite rapid mapping activations follow a consistent pattern: urgency followed by waiting, followed by intense analysis, followed by delivery of a product that helps people on the ground make better decisions. The entire cycle — from earthquake or flood to map in responders' hands — can happen in under 24 hours. But making it happen consistently requires meticulous preparation and practiced coordination.
The Activation Chain
Step 1: Disaster Triggers Activation (0-4 hours)
A significant natural disaster occurs. An authorized user — typically a national civil protection agency, UN agency, or the European Commission — submits an activation request to one or more satellite rapid mapping services:
Copernicus Emergency Management Service (EMS): Activated by EU member states, EU institutions, or participating states. Available 24/7.
International Charter "Space and Major Disasters": Activated by member space agencies on behalf of disaster response organizations. ESA describes the arrangement as taking "advantage of observations from a multitude of satellites" contributed by its member agencies, pooled into a single acquisition and delivery system.
Sentinel Asia: Activated for Asia-Pacific disasters through JAXA.
The activation request specifies:
- Area of interest (AOI) — where to image
- Type of product needed (first estimate, delineation, grading)
- Priority and urgency level
Step 2: Satellite Tasking (2-8 hours)
The mapping service identifies available satellite passes over the AOI:
Pre-event data check: Is recent (<1 year) archive imagery available for baseline comparison? For Sentinel-1/2, the answer is almost always yes due to systematic global acquisition.
Post-event acquisition planning: Which satellites will pass over the AOI in the next 24-72 hours? Options include:
- Sentinel-1 (SAR, free, 6-12 day revisit)
- Sentinel-2 (optical, free, 5-day revisit)
- Commercial SAR (ICEYE, Capella, COSMO-SkyMed — 1-3 day revisit but at cost)
- Commercial optical (WorldView, Pléiades, SkySat — tasked acquisition)
Priority: SAR first (weather independent) for immediate extent mapping; VHR optical for detailed damage assessment when weather permits.
Step 3: Data Acquisition (4-48 hours)
This is typically the bottleneck. The satellite must:
- Pass over the AOI (orbital timing)
- Acquire suitable imagery (correct mode, sufficient coverage)
- Downlink data to a ground station
- Process to analysis-ready level
For SAR (Sentinel-1): Data available within 1-3 hours of acquisition from ESA's Copernicus Data Hub. Near-real-time processing provides data within 30 minutes in some configurations.
For commercial VHR optical: Typically 4-12 hours from acquisition to delivery, depending on the provider and ground station geometry.
Step 4: Analysis (4-12 hours)
Once imagery is received, analysis begins immediately:
Automated pre-processing: Geometric correction, radiometric calibration, co-registration with pre-event imagery.
Change detection: Automated algorithms identify potential damage areas:
- SAR: Coherence change, backscatter difference
- Optical: NDVI difference, spectral change, building detection
Expert verification: Human analysts review automated detections, correct false positives, and identify damage that algorithms missed. This step is critical — fully automated damage maps have unacceptable false alarm rates for operational use.
Cartographic production: Analysts create standardized map products following established symbology and layout conventions.
Step 5: Delivery and Dissemination (Within 24 hours of activation)
Products are delivered through secure web platforms:
- Vector data (GIS-ready shapefiles/GeoJSON) for integration with responders' GIS systems
- PDF maps with standardized layout for printing and field use
- Web map services for online viewing
The Copernicus EMS works to published target delivery times measured in hours from image reception for its fastest products, with more detailed products following over the next days. It also delivers the vector data first and the map and summary table about two hours later, on the reasoning that responders' GIS systems can consume the vectors before a cartographic product exists:
- First product (rush mode): hours after satellite data receipt
- Detailed products: typically the following day or two
- Monitoring updates: Ongoing as new satellite data becomes available
Product Types
Reference Map
Pre-disaster baseline map showing:
- Settlement boundaries and building footprints
- Transportation network (roads, bridges, railways)
- Hydrography (rivers, lakes, dams)
- Critical facilities (hospitals, schools, government buildings)
- Population estimates
This product establishes the "before" picture. It's often generated from archive satellite imagery and existing geospatial databases.
Delineation Map
The extent of the disaster impact:
- Flood extent (water boundary from SAR or optical)
- Fire perimeter (burn extent from NDVI change)
- Earthquake-affected area (seismic intensity contours + coherence change)
- Landslide inventory (spatial distribution of triggered landslides)
Grading Map
Damage severity assessment:
- Per-building damage grades (D1-D5 for earthquakes)
- Infrastructure damage inventory
- Agricultural/crop damage extent
- Transportation accessibility status
This is the most labor-intensive product, often requiring expert interpretation of VHR optical imagery.
What Makes Rapid Mapping Work
Pre-Positioned Baseline Data
The most critical preparation happens before any disaster occurs:
- Global Sentinel-1/2 archive: Systematic acquisition means pre-event data exists everywhere
- Building footprint databases: OpenStreetMap, Microsoft Building Footprints, Google Open Buildings
- Population data: WorldPop, GHSL providing gridded population estimates
- Road networks: OpenStreetMap providing global transportation data
Without these baselines, change detection is impossible and map products can't convey meaningful context.
Standardized Workflows
Every activation follows the same process:
- Same activation procedures (practiced through regular exercises)
- Same analysis methods (documented, validated, reproducible)
- Same product formats (field responders trained on the symbology)
- Same quality control (peer review before delivery)
Standardization enables speed. When a mapper receives a new activation, they don't need to design a workflow — they execute a practiced one.
Volunteer Technical Communities
Organizations like the Humanitarian OpenStreetMap Team (HOT) mobilize hundreds of volunteer mappers within hours of a disaster. These volunteers digitize building footprints, roads, and other features from satellite imagery, creating the baseline data that professional damage assessors need.
During major disasters, thousands of volunteers may contribute, mapping features that no institutional capacity could produce as quickly.
Rapid Mapping Timeline and Product Standards Reference
| Stage | Activity | Typical Duration | Key Output |
|---|---|---|---|
| Disaster trigger | Event occurs; activation request submitted | 0–4 hours post-event | Activation case opened |
| Satellite tasking | AOI defined; satellite passes identified; archive data confirmed | 2–8 hours | Acquisition plan; pre-event data confirmed |
| SAR acquisition (Sentinel-1) | Orbital pass + downlink + processing | 4–24 hours | SAR GRD / SLC product |
| Commercial SAR (ICEYE, Capella) | Tasked within 1–3 day revisit | 4–12 hours after tasking | Very high resolution SAR |
| VHR optical (WorldView, Pléiades) | Cloud-dependent; 6–48 hours | 4–12 hours from acquisition | Sub-meter damage imagery |
| Automated change detection | SAR coherence / backscatter diff; optical NDVI diff | 1–3 hours | Candidate damage polygons |
| Expert verification + cartography | Human analyst review; symbology; QA/QC | 3–8 hours | Draft map product |
| Rush product delivery | First estimate product released | Hours after data receipt | Vector data first, then PDF map (Copernicus EMS) |
| Detailed grading map | Building-level VHR damage assessment | 24–72 hours | Per-structure D1–D5 grades |
| Monitoring updates | Each new satellite acquisition | Ongoing (every 6–12 days) | Updated delineation/grading maps |
How accurate are the products? Accuracy is reported per activation rather than as a service-wide figure, because it depends on the sensor used, the acquisition geometry, how much time elapsed between the event and the image, and the type of damage. The general ordering is stable, though, and worth knowing before you use a rush product:
- Flood delineation from SAR is the most reliable of the three. Open water in flat terrain is an unambiguous radar signature; the errors concentrate in urban flooding, flooded vegetation and areas of radar shadow.
- Earthquake damage grading is less reliable, because a nadir view sees roofs. Collapsed structures are detected well; damage confined to walls and interiors is systematically under-detected, so grading maps tend to understate the lower damage grades.
- Landslide inventories depend heavily on landslide size relative to pixel size and on the contrast between the failure scar and the surrounding land cover. Small failures under canopy are routinely missed.
In every case the number that matters is the one reported in that activation's own quality assessment, not a headline figure.
Limitations and Honest Expectations
Not every disaster gets satellite coverage: Activation mechanisms have eligibility criteria. Small-scale or slow-onset disasters may not qualify for emergency satellite tasking.
First products are rough: Rush-mode products prioritize speed over accuracy. They provide extent estimates and preliminary damage indications, not definitive assessments.
Satellite data is one input, not the answer: Field responders need satellite maps combined with ground observations, casualty reports, and logistical information. The satellite product is valuable but incomplete.
Resolution matters: At 10m (Sentinel-2) resolution, individual building damage can't be assessed. VHR commercial data provides this detail but takes longer to acquire and costs money.
Verification takes time: The most accurate damage assessments combine multiple satellite acquisitions over days, expert analysis, and ground validation. Final products may take weeks to complete.
The Human Element
Technology enables rapid mapping, but people make it work. Behind every activation:
- Duty officers monitoring 24/7 for disaster events and activation requests
- Image analysts interpreting satellite data under time pressure
- Cartographers producing clear, standardized map products
- IT specialists maintaining processing pipelines and delivery platforms
- Coordinators liaising with satellite operators, response agencies, and mapping teams
The system works because these people have practiced, prepared, and committed to delivering actionable information when disaster strikes. The satellite is just the sensor — the value comes from the entire chain of people and processes that turn pixels into decisions.
Rapid damage mapping represents one of the most direct humanitarian applications of Earth observation technology. Every activation is a reminder that satellite data has real consequences: the maps influence where rescue teams search, where aid is distributed, and how resources are allocated. Getting it right — quickly and accurately — matters.

Remote sensing specialist with 10+ years in satellite data processing and AI. Founder of Off-Nadir Lab. Ph.D. in Informatics (Yokohama National University, 2026). Master's in Earth System Science and Technology (Kyushu University). Co-author, Remote Sensing Encyclopedia. More about the author →