
Browser-Based WebGIS vs. Desktop GIS Software: When Each Approach Makes Sense
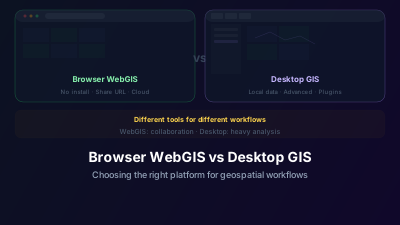
Quick Answer: Browser-based WebGIS platforms excel at rapid data discovery, visualization, and collaboration — no installation required. Desktop GIS software is stronger for heavy computation, custom analysis, and working with local datasets. Most professionals use both: browser tools for exploration and sharing, desktop tools for deep analysis.
The short answer: browser-based WebGIS wins on data discovery, visualization, and sharing; desktop GIS wins on heavy computation, custom analysis, and offline work. Most professionals use both, in different phases of the same workflow. The rest of this post breaks down where each approach actually earns its place.
Two Paradigms
There was a time when working with satellite imagery meant installing hundreds of megabytes of software, managing license keys, and configuring data paths. That's still one way to do it — and for certain tasks, it remains the best way.
But a parallel ecosystem has emerged: browser-based platforms that let you search, visualize, and analyze satellite data directly from a web browser. No installation, no license management, no local storage concerns.
Neither approach is universally better. They solve different problems, and understanding the tradeoffs helps you pick the right tool for each task.
Installation and Setup
Desktop GIS
You download an installer, configure it, install plugins for specific data formats, and manage updates. Some packages require specific operating system versions or hardware capabilities. The initial setup can take anywhere from ten minutes to several hours depending on the software and your workflow requirements.
The upside: once installed, you have a fully self-contained environment that doesn't depend on internet connectivity.
Browser-based WebGIS
You open a URL. That's the setup. Any device with a modern browser works — laptop, tablet, shared office computer. Updates happen server-side; you always get the latest version.
The downside: you need a reliable internet connection, and you're dependent on the platform's availability.
Verdict: For quick access and low barrier to entry, browser-based wins. For offline work or air-gapped environments, desktop is necessary.
How does data access differ?
This is where the paradigm shift is most dramatic. Desktop workflows download whole scenes — often hundreds of megabytes each — before you can view a single pixel, while browser platforms stream only the tiles visible at your current zoom level directly from cloud storage. That difference turns an hour-long download-and-import cycle into a search that finishes in under a minute.
Desktop GIS
You typically need to download data before you can view it. That means:
- Navigate to a data portal (for Sentinel data, the Copernicus Data Space Ecosystem)
- Search for imagery by location, date, and parameters
- Download files (often hundreds of MB to several GB per scene)
- Import into your GIS project
- Configure visualization parameters
Steps 1-4 can easily take 30 minutes to an hour per dataset, longer if the download is slow or the portal is congested.
Browser-based WebGIS
Modern platforms query STAC APIs and stream Cloud-Optimized GeoTIFF (COG) tiles on demand:
- Draw a bounding box or navigate to your area
- Search for data by date and parameters
- Click to add imagery to the map
The data streams from cloud storage — you see only the tiles you need at your current zoom level. The COG specification (cogeo.org) describes the format as "a regular GeoTIFF file, aimed at being hosted on a HTTP file server, with an internal organization that enables more efficient workflows on the cloud" — and that internal organization is exactly what makes see-only-what-you-need streaming possible. A task that takes an hour in the download-then-view workflow takes under a minute. (For the full architecture behind this, see how modern WebGIS platforms work.)
Verdict: For data discovery and initial visualization, browser-based platforms are dramatically faster. If you need the raw pixels for offline processing, you still need to download.
Processing and Analysis
Desktop GIS
This is desktop GIS's home territory. You have full access to:
- Raster algebra (band math, indices, classification)
- Vector operations (buffer, intersect, spatial join)
- Custom scripts and automation
- Plugin ecosystems with specialized tools
- Full control over coordinate reference systems and resampling methods
For computationally intensive tasks — classifying a 10,000 km² scene, running machine learning models, or batch-processing a year of imagery — desktop software with local hardware is usually faster and more flexible.
Browser-based WebGIS
Browser platforms are inherently limited by what runs in a browser and what the server exposes as API endpoints. Common capabilities include:
- Visual comparison of multi-temporal imagery
- Pre-computed indices (NDVI, etc.)
- Basic measurement tools
- Layer overlay and transparency adjustment
More advanced platforms offer server-side processing for specific operations, but you're constrained to what the platform has implemented. Custom analysis pipelines are generally not supported.
Verdict: For deep, custom analysis, desktop GIS is essential. For standard visualization and pre-built workflows, browser-based platforms are sufficient and faster to set up.
Collaboration and Sharing
Desktop GIS
Sharing results typically means exporting maps as images or PDFs, packaging project files for colleagues (who need the same software), or setting up a separate map server to publish results online.
Browser-based WebGIS
Sharing is a URL. Anyone with the link can see the same view, the same layers, the same analysis. No software installation required on the recipient's end.
For briefing non-technical stakeholders — emergency managers during a flood event, agricultural clients reviewing crop health, or team members in the field — this difference is significant.
Verdict: Browser-based platforms are far superior for sharing and collaboration.
Which approach costs more?
For individuals and small teams, browser platforms usually cost less: free tiers cover exploration, hardware requirements are minimal, and there is no license administration. Desktop can be free too (QGIS), but commercial seats run to thousands of dollars per year, and serious processing assumes capable local hardware. At organizational scale, the answer depends on what infrastructure already exists.
Desktop GIS
The landscape ranges from free open-source options with steep learning curves to commercial products with annual license fees that can run into thousands of dollars per seat. Enterprise deployments may require additional server infrastructure.
Browser-based WebGIS
Most browser platforms offer free tiers with usage limits and paid plans for higher volumes. The infrastructure cost is borne by the platform provider, not the user. You don't need powerful local hardware — the heavy lifting happens server-side.
Verdict: Depends on scale. For individual users or small teams, browser-based platforms are typically more cost-effective. For organizations with existing GIS infrastructure and dedicated analysts, the investment in desktop software may already be justified.
Capability Comparison: Browser WebGIS vs. Desktop GIS
| Dimension | Browser WebGIS | Desktop GIS |
|---|---|---|
| Setup time | Seconds (open URL) | 30 min to several hours |
| Internet required | Yes — always | No (once installed) |
| Data access | Instant streaming via STAC/COG | Download first (30 min – several hours per scene) |
| Custom analysis | Pre-built indices and workflows only | Full raster/vector algebra, ML pipelines, scripting |
| Collaboration | Share via URL; recipient needs no software | Export files; recipient needs same software |
| Hardware requirement | Any modern browser device | Powerful CPU/RAM for large datasets |
| Upfront cost | Free tier typically available | Free (QGIS) to a commercial per-seat subscription (e.g. ArcGIS Pro) |
| Offline capability | None | Full (after data download) |
| Processing large scenes | Server-side, limited | Local GPU/CPU, unlimited |
| Learning curve | Low (intuitive UI) | Moderate to high (projection systems, raster algebra) |
| Best for | Discovery, monitoring, sharing | Deep analysis, batch processing, custom pipelines |
The "streaming vs. download" distinction is bigger than it sounds. A full-resolution Sentinel-2 scene is a multi-band product of several hundred megabytes; streaming delivers only the handful of tiles covering what is currently on screen at the current zoom level, which is a tiny fraction of that. The practical consequence is that first pixels appear in seconds rather than after a download that has to complete before you can look at anything.
The Practical Reality: Use Both
In practice the two are rarely an either/or choice — they suit different phases of the same workflow:
- Discovery and reconnaissance → Browser-based. Search for data, visually scan for the right scenes, check cloud cover and coverage
- Detailed analysis → Desktop GIS (if needed). Download the specific scenes you've identified and run your analysis pipeline
- Results sharing → Browser-based. Upload derived products and share with stakeholders via URL
The browser platform reduces the time spent on step 1 from hours to minutes, which means more time available for the analytical work in step 2.
When is a browser-based platform enough?
If your work consists of viewing recent imagery over an area of interest, comparing dates visually, and sharing what you see, a browser platform covers the complete workflow — no desktop software, training, or local storage required. The handoff to desktop GIS only becomes necessary when you need custom processing chains or the raw pixels for offline analysis. Typical browser-only workflows:
- Viewing recent satellite imagery over a specific area (browse the available data sources)
- Monitoring changes over time through visual comparison
- Sharing satellite views with colleagues or clients
- Learning remote sensing concepts with real data
Off-Nadir Delta is designed for exactly this use case — satellite data access and visualization without the overhead of traditional GIS software.

Remote sensing specialist with 10+ years in satellite data processing and AI. Founder of Off-Nadir Lab. Ph.D. in Informatics (Yokohama National University, 2026). Master's in Earth System Science and Technology (Kyushu University). Co-author, Remote Sensing Encyclopedia. More about the author →