
Panchromatic Imagery: What It Is vs Multispectral
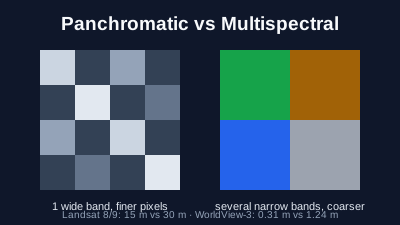
Quick Answer: Panchromatic imagery is a single band that records light across a broad range of wavelengths, mostly the visible spectrum, as one greyscale image. Because the band is wide, each detector collects more light, which lets the sensor use smaller pixels: Landsat 8 and 9 record panchromatic at 15 m and their colour (multispectral) bands at 30 m, and WorldView-3 records 0.31 m panchromatic and 1.24 m multispectral at nadir. Multispectral bands are narrower and separate colours and infrared, which is what makes vegetation indices and material mapping possible. Pan-sharpening combines the two into a colour image at the panchromatic resolution. Sentinel-2 has no panchromatic band.
Panchromatic imagery is a black-and-white satellite image recorded in one wide band of light. It is sharper than the colour bands of the same satellite: on Landsat 8 and 9 the panchromatic band is 15 m and the multispectral bands are 30 m; on most very-high-resolution satellites the panchromatic band is four times finer than the colour bands. The colour bands carry the information about what a surface is made of; the panchromatic band carries the detail of its shape.
What is panchromatic imagery?
A panchromatic image is recorded in a single wavelength region that spans most of the visible spectrum, so it has one value per pixel and is displayed in greyscale. The Belgian Earth observation platform defines panchromatic images as "images obtained from recording in a single wavelength region in visible light, i.e. between 0.4 and 0.7 µm" (BELSPO). Natural Resources Canada describes it as "sensing a broad range of all visible wavelengths" (NRCan).
In practice the exact band differs by satellite, and some extend into the near infrared. The panchromatic band on Landsat 8 and 9 covers 0.50–0.68 µm, while the one on Landsat 7 covers 0.52–0.90 µm, well into the near infrared (USGS: Landsat band designations). WorldView-3's covers 450–800 nm (ESA Earth Online). NASA notes that the extra near-infrared light in the Landsat 7 band changes the tone of the image when it is used for sharpening (NASA Science).
The word comes from photography: panchromatic film is black-and-white film sensitive to all visible colours. The satellite band works the same way. It does not record colour; it records how much light arrives, summed over a wide range of colours.
Why is the panchromatic band sharper than the colour bands?
Because the band is wide, more light reaches each detector. A narrow colour band lets through only a slice of the spectrum, so its detectors need a larger footprint on the ground to collect enough light for a clean signal. The panchromatic band collects light across the whole visible range, so each detector can look at a smaller patch of ground and still get a usable signal. BELSPO states that with the wider spectral range "more energy ends up at the photocells", which allows the instantaneous field of view to be made smaller, "resulting in more spatial detail" (BELSPO).
The trade is between spectral and spatial detail. A sensor can split light into many narrow bands or record fine detail, but with a fixed amount of light reaching each detector it is hard to do both in the same band. Putting one wide high-resolution band next to several narrow coarser ones gives the user both, in two separate images.
How does panchromatic compare with multispectral, satellite by satellite?
On every satellite below the panchromatic band is sharper than the multispectral bands, by a factor of two on Landsat and four on the commercial very-high-resolution satellites. The numbers are the resolution at nadir (looking straight down) as published by the operator or the space agency that distributes the data. Sentinel-2 is included because it is the most used free optical satellite, and it has no panchromatic band.
| Satellite | Panchromatic band | Multispectral bands | Ratio | Source |
|---|---|---|---|---|
| Landsat 8 and 9 (OLI) | 15 m, 0.50–0.68 µm | 30 m | 1:2 | USGS |
| Landsat 7 (ETM+) | 15 m, 0.52–0.90 µm | 30 m | 1:2 | USGS |
| SPOT 6 and 7 | 1.5 m | 6 m | 1:4 | ESA Earth Online |
| Pléiades 1A and 1B | 0.5 m (products) | 2 m (products) | 1:4 | ESA Earth Online |
| Pléiades Neo | 0.3 m | 1.2 m | 1:4 | Copernicus Data Space |
| WorldView-3 | 0.31 m | 1.24 m | 1:4 | ESA Earth Online |
| Sentinel-2 (MSI) | None | 10 m, 20 m and 60 m bands | — | ESA SentiWiki |
The Pléiades values are the delivered product resolutions. The Belgian Pléiades access programme states that the panchromatic image is recorded at 70 cm and resampled to 50 cm, and the multispectral image at 2.8 m resampled to 2 m (Pleiades4Belgium). Published resolutions also get coarser away from nadir, when the satellite looks to the side.
What can multispectral bands show that panchromatic cannot?
Multispectral bands show what a surface is made of. Vegetation, water, bare soil and roofs can look similar in a greyscale image but reflect red, near-infrared and shortwave-infrared light very differently. Separate bands let an analyst compute indices such as NDVI for vegetation or NDWI and MNDWI for water, build false-colour composites, and classify land cover. A single panchromatic value per pixel cannot do any of that.
NRCan makes the same point for vegetation stress: a narrow red band is more sensitive to it than broad panchromatic imagery (NRCan). Panchromatic imagery is the better choice when the question is about shape and position: counting buildings, tracing roads, measuring a runway, or seeing whether a vehicle is parked in a yard. The electromagnetic spectrum guide explains what each part of the spectrum reveals.
What is pan-sharpening, and what does it change?
Pan-sharpening merges a panchromatic band with the multispectral bands of the same scene to produce a colour image at the panchromatic resolution. NASA describes it as "a technique that combines the high-resolution detail from a panchromatic band with the lower-resolution color information" from the other bands (NASA Science). On Landsat it turns 30 m colour into 15 m colour; on WorldView-3 it turns 1.24 m colour into about 0.3 m colour.
The result looks sharper, but the colours are an estimate at the finer scale, not a measurement. The panchromatic band does not cover exactly the same wavelengths as the colour bands, so the tone of the merged image shifts, as NASA notes for Landsat. Planet describes its pan-sharpened SkySat product as "uncalibrated", separate from its calibrated analytic product (Planet docs). For measurements such as reflectance or vegetation indices, use the original multispectral bands. The methods and their side effects are covered in Pansharpening: How to Get High-Resolution Multispectral Imagery.
Does Sentinel-2 have a panchromatic band?
No. Sentinel-2's MultiSpectral Instrument has 13 bands: four at 10 m (blue, green, red and near infrared), six at 20 m (red edge, narrow near infrared and two shortwave infrared) and three at 60 m for atmospheric correction (ESA SentiWiki). None of them is a broad panchromatic band. Its finest detail is therefore 10 m, in colour and near infrared at the same time, which is enough for fields, forests, floods and large buildings but not for vehicles or small structures.
Among the widely used free missions, Landsat 8 and 9 are the ones with a panchromatic band, at 15 m. Detail finer than that comes from commercial satellites, almost always with a panchromatic band at the finest resolution. Free vs Commercial Satellite Imagery compares the two worlds, and What Can You See in 10 m Satellite Imagery? shows what 10 m resolves.
How does this apply in Off-Nadir Delta?
Off-Nadir Delta serves Sentinel-2 Level-2A imagery, the 10 m multispectral bands without any panchromatic band, and it does not pan-sharpen. In the workspace map you can show a scene in true colour, false colour or NDVI. The Sentinel-2 viewer page shows recent passes in natural colour at 30 m without an account. For very-high-resolution panchromatic imagery you need a commercial provider; the resolution guide explains how to decide whether you need it.
Related reading

Remote sensing specialist with 10+ years in satellite data processing and AI. Founder of Off-Nadir Lab. Ph.D. in Informatics (Yokohama National University, 2026). Master's in Earth System Science and Technology (Kyushu University). Co-author, Remote Sensing Encyclopedia. More about the author →