
Can Satellites See Underground? Radar, InSAR and Gravity
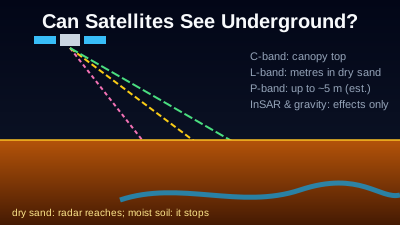
Quick Answer: Mostly no. Optical cameras and thermal sensors measure only the surface; thermal can show heat that reaches the surface from below, such as a coal-seam fire. Radar is the exception: in very dry sand, L-band radar (24 cm) imaged buried river channels in the Sahara from the Space Shuttle in 1981, and ESA estimates its P-band Biomass satellite can reach up to 5 m into dry sand. Moist soil stops radar within much less. Two other techniques infer what happens underground without seeing it: InSAR measures millimetre-scale ground movement caused by groundwater pumping, mining or tunnelling, and GRACE-FO measures changes in water mass, including groundwater, over areas of about 150,000 km² per month.
Mostly no. A satellite camera or thermal sensor measures the top surface of the ground, so it cannot see a pipe, a cave or a tunnel. Radar is the partial exception: long-wavelength radar can reach a few metres into very dry sand. Two other techniques do not see underground at all but measure the effects of what happens there: radar interferometry (InSAR) measures the ground surface moving, and gravity satellites measure water mass changing. Each is explained below with the public missions that use it.
Which satellite techniques sense below the surface, and how deep?
Only radar penetrates the ground itself, and only in dry material: about a few metres of very dry sand at L-band and an estimated 5 m at P-band. Optical and thermal sensors stop at the surface. InSAR and gravity missions do not image the subsurface; they measure surface movement and mass change caused by it. The table lists each technique with a source per row.
| Technique | What it senses, and how deep | Ground detail | Example mission (source) |
|---|---|---|---|
| Optical (visible to shortwave infrared) | Reflected sunlight from the top surface; no penetration | 10 m bands | Sentinel-2 (SentiWiki) |
| Thermal infrared | Heat emitted by the surface; heat from below shows only where it reaches the surface | 100 m | Landsat 9 TIRS-2 (USGS) |
| C-band radar (5.55 cm) | Top layers of a forest canopy; little penetration elsewhere | 5 m × 20 m (IW mode) | Sentinel-1 (SentiWiki, NASA Earthdata) |
| L-band radar (24 cm) | Through canopy; a few metres into very dry sand, little into moist soil | Mission-dependent | SIR-A, 1981 (Elachi, Caltech Engineering & Science, 1983) |
| P-band radar (~70 cm) | Through forest canopy; estimated up to 5 m into dry sand | Not given on the ESA pages cited | Biomass (ESA fact sheet, ESA Earth Online) |
| InSAR (radar phase between passes) | Movement of the surface, from causes at any depth; sees no subsurface itself | A few millimetres of movement | Sentinel-1, ENVISAT (USGS Fact Sheet 069-03) |
| Satellite gravimetry | Change in mass of the whole column, including groundwater | No better than ~150,000 km², monthly | GRACE-FO (NASA Earthdata) |
Depth figures for radar are for the driest conditions; the section on radar below explains why moisture changes them so much.
Why can't optical and thermal satellites see underground?
Optical satellites record sunlight reflected by whatever is on top, whether soil, rock, roofs or leaves, and that light does not travel through soil. Thermal sensors record the heat a surface emits; USGS describes Landsat's thermal instrument as measuring "thermal infrared radiation, or heat, emitted from the Earth's surface" (USGS: Landsat 9). Neither returns information from below the surface.
What thermal sensors can show is an underground source of heat that warms the surface above it. Coal-seam fires are the clearest documented case. A study of the Wuda coalfield in China used ASTER thermal infrared images, with ground temperatures measured during the satellite overpass, and found that detected fire areas matched fire spots mapped in the field with a matching rate of 70–85% (Du et al., Remote Sensing, 2015). The satellite measured the warm ground, not the fire.
The same limit applies to Sentinel-2's 10 m bands: they show surface clues such as disturbed soil, spoil heaps or vegetation stress, and any reading of what lies beneath is an inference. For thermal sensing in general, see Land Surface Temperature: Thermal Remote Sensing and the thermal anomaly entry in the glossary.
How deep can satellites see underground with radar?
Radar can see underground only in very dry material, and only to a depth of metres. The 24 cm L-band radar on the Space Shuttle's SIR-A mission in 1981 imaged river channels buried under the eastern Sahara; theory suggested 2 to 6 m of penetration, and about 40 pits dug at the site found sand 0.8 to 2.5 m deep. Moist soil attenuates radar far more quickly.
The account comes from the mission's principal investigator, Charles Elachi, writing in 1983: "Radar waves are attenuated by the electrical properties of moist soil, but very dry sand would theoretically let the radar signal pass through a sand cover," and in the eastern Sahara, "where it rains only about every 50 years," the waves "could probe through a sand layer a few meters thick" (Elachi, Engineering & Science, 1983). He also states that SIR-A's signal had a 24-centimetre wavelength, and that "about 10 percent of the earth's surface is arid enough to get some radar penetration below the surface." A JPL retrospective puts the result as imaging "as deep as 3 meters (9 feet) below the sand" (NASA JPL, 2001), and the SIR-A mission page records that it "helped detect the remnants of buried ancient riverbeds in the Sahara Desert."
Wavelength sets how far the signal gets. NASA Earthdata's band table runs from X-band (2.4–3.8 cm) to P-band (30–100 cm), and notes that "a C-band signal penetrates only into the top layers of the canopy of a forest," while "an L-band or a P-band signal will have much deeper penetration" (NASA Earthdata: SAR). Sentinel-1's C-band at 5.405 GHz is about 5.55 cm (SentiWiki), which is why it is the wrong tool for this question even though it sees through clouds; the physics behind cloud penetration is in Why SAR Can See Through Clouds.
Is there a satellite now that can see under desert sand?
Yes, within limits. ESA's Biomass satellite, launched on 29 April 2025, carries the first P-band radar in space, at a wavelength of around 70 cm (ESA fact sheet). Its data have been open since January 2026 (ESA, 26 January 2026). Its main job is forest biomass, but it also images desert subsurface.
An ESA Earth Online story from 15 September 2026 reports that Philippe Paillou of the University of Bordeaux "estimates that Biomass can penetrate up to 5 metres into dry sand," and that a P-band visualisation "shows many dead tributaries of the present-day Nile" (ESA Earth Online). The same story connects the work to the SIR-A results of 1981. ESA's fact sheet lists "underground geology in deserts to study the remains of ancient riverbeds and lakes" among the mission's uses beyond forests.
Note the conditions in every one of these sources: dry sand. The 5 m figure is an estimate for that case, not a general depth for soil.
Can satellites see underground water?
Not directly, but gravity satellites can weigh it. GRACE (2002–2017) and GRACE-FO (2018–present) measure monthly changes in terrestrial water storage, which NASA defines as "the sum of groundwater, soil moisture, surface waters, snow, and ice," at "spatial resolutions no better than about 150,000 km² at mid-latitudes" (NASA Earthdata). That is a basin-scale signal, not a map of aquifers or wells.
The measurement works by ranging between two satellites. GRACE-FO's twin spacecraft fly about 220 km apart and track the distance between them; changes in that distance, as each passes over more or less mass, are turned into monthly maps of the gravity field (NASA JPL: GRACE-FO). GRACE-FO completed its five-year prime mission in May 2023 and is in extended operations, and its successor GRACE-C is scheduled for launch at the end of 2028 (EGU26-16387). The same NASA page notes that the coarse resolution "limits regional-scale groundwater assessments", and the groundwater share of the signal has to be separated from soil moisture, snow and surface water with other data. The case studies are covered in Tracking Groundwater Depletion from Space: The GRACE Gravity Mission.
Pumped aquifers also show up a second way: the ground above them sinks, and InSAR can measure that.
How does InSAR detect what happens underground?
InSAR compares the phase of two radar images of the same place taken from the same orbit at different times. If the ground moved between them, the phase changes, and USGS says the method can map surface changes "as small as a few millimeters" (USGS Fact Sheet 069-03). The cause can be deep underground, but InSAR sees only the surface moving.
USGS lists the principal causes of subsidence as "aquifer-system compaction, drainage of organic soils, underground mining, hydrocompaction, natural compaction," along with sinkholes and thawing permafrost, and gives InSAR's precision under ideal conditions as 5 to 10 mm at the scale of one pixel (USGS Fact Sheet 051-00). One documented case: near Pomona, California, "more than 180 mm of ground-water-pumping induced subsidence (1993–95) resulted in cracked building foundations" (USGS Fact Sheet 069-03).
Underground events leave the same kind of trace. Radar interferometry over the Nevada Test Site found subsidence of "one to several centimeters distributed over an area 1-2 kilometers across" above past underground nuclear tests, whether or not a test had left a surface crater (Vincent et al., Geophysical Research Letters, 2003, USGS). How the phase measurement works is explained in InSAR Explained: How Satellites Measure Ground Movement; city-scale subsidence cases are in Ground Subsidence Monitoring with InSAR.
Can satellites see underground tunnels?
Not as an image of the tunnel. What public sources document is the surface effect of tunnelling: ground settling above an excavation, measured with InSAR. In Genoa, Italy, Sentinel-1 interferometry over a 3.71 km tunnel found cumulative movement of up to 30 mm in the radar's line of sight during excavation, tracking the advance of the tunnel face (Roccheggiani et al., Remote Sensing, 2019).
That study also shows the limit. The settlement was clearest "where the subsurface is characterized by clay and alluvial deposits" and under large buildings, and the authors attribute part of it to changes in groundwater pressure around the excavation. A tunnel that disturbs neither the groundwater nor the soil above it gives InSAR nothing to measure. Radar penetration does not close the gap either: the documented metres of penetration are for very dry sand, and a tunnel is usually under rock, moist soil or both.
Other things visible from orbit are surface ones: entrances, ventilation shafts, spoil heaps, roads and construction activity, seen in optical or radar images, and heat at an opening, seen by a thermal sensor if it is large and warm enough. Whether a given tunnel can be inferred from these depends entirely on the site. The capabilities of classified government systems are not published, and this article does not speculate about them; every sensor, whoever owns it, works within the same physics of wavelength and moisture described above. For what openly available imagery shows of conflict areas, see What Free Satellite Imagery Shows of War.
Can satellites see through buildings?
No. Optical and thermal sensors see roofs and walls, and radar is reflected by them. NASA Earthdata lists "double bounce" scattering, "caused by buildings, tree trunks, or inundated vegetation," as one of the main ways radar returns from a scene (NASA Earthdata: SAR). Buildings appear in radar images as bright returns from their shape, not as views of their interiors.
Radar does see things that clouds, smoke, darkness or canopy hide from a camera, which is the source of most "sees through" claims. Darkness is covered in Can Satellites See at Night?, and what a given pixel size can and cannot show is in Can Satellites See People and License Plates?.
What can you look at in Off-Nadir Delta, and what can't you?
Off-Nadir Delta serves radar backscatter images, not subsurface measurements. It shows Sentinel-1 C-band radar, included in the free plan, and NISAR L-band radar from the NASA-ISRO mission, launched on 30 July 2025 with a 24 cm L-band radar (NASA). It does not compute InSAR, and it carries no gravity or P-band data.
The NISAR layer is the L2 GCOV product, terrain-corrected backscatter in HH and HV on a 10 m grid, from a collection labelled provisional, so its values are indicative rather than calibrated measurements. It is on the plans listed in Pricing, and a 3-day pass opens viewing it; the NISAR L-band viewer page describes it, and NISAR L-Band SAR vs Sentinel-1 C-Band explains what the longer wavelength changes. Sentinel-1 is in the Sentinel-1 SAR viewer.
What the product does not do, stated plainly:
- No InSAR. The radar products served are amplitude (detected) images; the phase that interferometry needs has already been discarded, so there are no deformation maps, subsidence rates or coherence products.
- No subsurface product. The water indices it computes (NDWI, MNDWI, NDMI) describe surface water and surface moisture. A shrinking reservoir is not a measurement of the aquifer beneath it.
- No GRACE-FO or Biomass data.
Amplitude change detection on Sentinel-1 can show that a surface was disturbed or a structure changed between two dates. It measures a different thing from InSAR and is not a coarse substitute for it. Terms used here, including InSAR, L-band and backscatter, are defined in the glossary.
Written by Kazushi Motomura. Sources were opened on 2026-10-29; mission status and data availability change, so check the linked pages for current dates.

Remote sensing specialist with 10+ years in satellite data processing and AI. Founder of Off-Nadir Lab. Ph.D. in Informatics (Yokohama National University, 2026). Master's in Earth System Science and Technology (Kyushu University). Co-author, Remote Sensing Encyclopedia. More about the author →