
Watching a Place: Measuring a Number vs Watching for Events
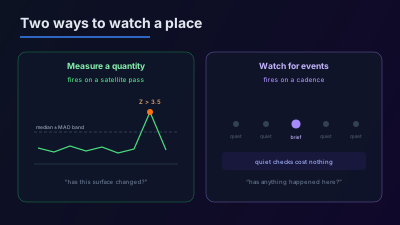
Quick Answer: There are two distinct ways to keep watching a place. A monitored area measures a quantity — NDVI, SAR backscatter, water extent — over a fixed polygon on each new usable satellite pass, and flags a reading when its modified Z-score exceeds 3.5 against the median of the last 30 measurements. A standing order watches a bounding box for events, checks it weekly, and notifies you only when new events cross the reporting bar. The first answers 'has this surface changed?'; the second answers 'has anything happened here?' Picking the wrong one is why a watch either stays silent through a real event or floods you with noise.
Setting up continuous monitoring is easy. Setting up the right continuous monitoring is where it usually goes wrong, and the failure is quiet: the watch runs for weeks, reports nothing, and the thing you were worried about happened anyway.
Almost always the cause is a mismatch between the question and the mechanism. "Keep an eye on this place" hides two different jobs, and they need different machinery.
What is the difference between measuring a place and watching it for events?
Measuring produces a number on a schedule set by orbits: a polygon, an index, and a value recomputed each time a satellite acquires usable imagery over it. Watching for events produces a judgement on a fixed schedule: an area, checked weekly, reported on only when new events cross the reporting bar. One is driven by satellite passes, the other by reported activity. They fail in opposite directions.
| Measuring a quantity | Watching for events | |
|---|---|---|
| Trigger | A new usable satellite pass | A weekly check |
| Input | A polygon and an index | A bounding box |
| Output | A time series with unusual readings flagged | A notification listing the new events, when something clears the bar |
| Detects | Physical change on the surface | Reported activity in the area |
| Blind to | Anything that does not alter the surface | Anything nobody reported |
| Typical failure | Silence, because the change was not radiometric | Noise, because the box was drawn too wide |
The blind spots are the important row. A measurement watch over a port cannot tell you a strike was announced; an event watch over the same port cannot tell you the berth emptied.
How does a measurement watch decide something is unusual?
It compares each new reading against the area's own recent history rather than an absolute threshold, because "normal" for a wheat field in July is not normal for the same field in December. The comparison uses a modified Z-score built on the median and the median absolute deviation: 0.6745 × (value − median) / MAD, evaluated against the most recent 30 measurements, with at least 5 required before anything is flagged.
The threshold is 3.5, following Iglewicz and Hoaglin as documented in the NIST Engineering Statistics Handbook, which recommends labelling modified Z-scores above 3.5 as potential outliers.
Median and MAD rather than mean and standard deviation is not a stylistic choice. One extreme reading inflates a standard deviation, which raises the very bar the reading is being judged against — the outlier partially hides itself. The median and MAD barely move, so a genuine spike stays a spike. This matters most in exactly the situation you built the watch for: the first anomalous pass after a long quiet stretch.
The robust anomaly detection approach has a practical consequence for setup. Because at least 5 measurements are needed, a brand-new watch is silent for its first weeks — with Sentinel-2 revisiting roughly every 5 days at the equator and cloud removing some of those passes, a new optical watch can take a month before it can flag anything. Starting a watch the day after an event is starting it too late.
Which index should a measurement watch track?
Pick the index that responds to the change you are worried about, not the one that is easiest to interpret. NDVI moves with vegetation vigour and is nearly useless for detecting a building. SAR backscatter responds to surface roughness and structure and keeps working through cloud and at night. NDWI moves with open water. A flood shows up strongly in SAR and NDWI and ambiguously in NDVI.
The common mistake is tracking one optical index over an area whose defining risk is invisible to it. Multi-index monitoring exists because a single number rarely separates causes: vegetation loss from drought and vegetation loss from clearing look similar in NDVI alone, and differ once SAR backscatter is beside it. If the area is cloudy for months at a time, an optical-only watch is not a watch — see SAR time-series monitoring for the all-weather alternative.
When is an event watch the right tool instead?
When the thing you care about would be reported before it is visible, or would never be visible at all. Sanctions, an evacuation order, a facility announcement, a border incident, an outage — none of these necessarily change a pixel value, and a measurement watch over the area will run for months without noticing. An event watch saves the area — in the app, "Watch this area" — checks it weekly, and notifies you — with the new events it found — only when new events in the box cross the reporting bar.
The box is the whole design. Draw it around the place you would want to be interrupted about, not the region it sits in: a wider box catches more reporting that has nothing to do with your question, and every notification about it is one more you learn to ignore.
Checks that find nothing are the normal case and should stay cheap — a watch over a quiet area costs nothing until something happens in it, which is what makes leaving several running viable.
Can the two be combined?
Yes, and for high-value sites that is the sensible default: an event watch to catch what gets reported, and a measurement watch to catch what does not. They cover each other's blind spots almost exactly.
The pairing also resolves attribution, which is the hardest part of reading a time series. A measurement watch tells you a value moved on a particular date. It cannot tell you why. When an event watch over the same box reported events that week, the anomaly stops being an unexplained data point. Running only the measurement half is how you end up with a chart of something unusual and no way to say what it was.
What should you check before trusting a watch?
Confirm that the sensor can see the change, that passes will actually arrive, and that the baseline exists.
Sensor: does the risk alter something the index responds to? Cadence: is the revisit fast enough for the decision, and will cloud remove most optical passes over this area? For a target where timing matters, work out the next satellite passes before assuming the watch will produce data when you need it — a 12-day repeat cycle over a persistently cloudy coast produces far fewer usable readings than the nominal figure suggests. Baseline: has the watch accumulated the minimum measurements yet, and does the recent history actually represent normal, or does it span a seasonal transition?
For the terms used here, the glossary defines revisit, backscatter, and spectral index. The mechanics of setting one up are covered in satellite area monitoring, and the step-by-step time-series guide walks through a first watch end to end.
A flagged reading is a statistical statement about a time series, not a finding about what happened on the ground. Anomaly detection narrows where to look; confirming the cause needs imagery, reporting, or both.

Remote sensing specialist with 10+ years in satellite data processing and AI. Founder of Off-Nadir Lab. Ph.D. in Informatics (Yokohama National University, 2026). Master's in Earth System Science and Technology (Kyushu University). Co-author, Remote Sensing Encyclopedia. More about the author →