
Layover and Shadow: How Much of a SAR Scene Is Actually Usable?
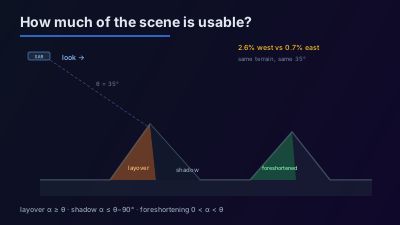
Quick Answer: SAR layover, shadow and foreshortening follow from one comparison: the terrain slope toward the sensor against the incidence angle. Layover occurs where the slope tilts toward the radar at or beyond the incidence angle, shadow where the back slope is steeper than the depression angle, and foreshortening in between. Because both incidence and look direction enter the calculation, the same terrain gives different answers on different passes — measured on one volcanic flank, layover covered 2.6% of the area looking west and 0.7% looking east at the same 35° incidence. Sentinel-1 looks right and NISAR looks left, so they lose opposite flanks of the same valley.
A SAR scene over mountains is not uniformly useful. Parts of it record two different pieces of ground in the same pixel, parts record nothing at all, and the boundaries between those regions are fixed by geometry that is known before the satellite passes.
That last point is the practical one. Layover and shadow are usually discussed as things you notice in a finished image. They are computable in advance, from terrain and pass geometry alone.
What causes layover, shadow and foreshortening?
All three come from radar measuring travel time from a side-looking sensor rather than angles from directly overhead. When terrain tilts toward the sensor, features at the top of a slope are closer than features at the bottom, so their echoes arrive sooner and the slope is compressed in the image. Push the tilt far enough and the ordering inverts entirely. Tilt the far side away steeply enough and no signal returns at all.
ESA's radar course sets out the conditions: foreshortening where slopes face the radar and compress, layover where the terrain inclination exceeds the sensor's depression angle so that valley targets have a larger slant range than the mountain tops above them, and shadow where a slope facing away is steeper than the depression angle.
How is the usable fraction of an area calculated?
Reduce it to one number per point: the slope measured in the sensor's ground-range direction. Call that slope toward the sensor α and the incidence angle θ. The local incidence angle is θ − α, and the three regimes fall out of it:
| Condition | Regime | What the pixel contains |
|---|---|---|
| α ≥ θ | Layover | Two or more surfaces stacked together |
| 0 < α < θ | Foreshortening | One surface, compressed in range |
| α ≤ θ − 90° | Shadow | No return |
| α ≤ 0 | Normal | One surface, tilted away but illuminated |
Run that test over a digital elevation model across an area and count how many samples land in each regime, and you get the fractions directly. The terrain comes from a global DEM — the Copernicus DEM GLO-30 instance — a global digital surface model at 1 arc-second spacing, free-licensed and derived from TanDEM-X — is the usual choice, and the comparison of elevation models covers when a finer one is worth the trouble.
Nothing here needs the imagery. It needs the terrain and two numbers off the scene: incidence angle and the compass bearing the sensor looks along.
Why does look direction change the answer so much?
Because α is the slope in the look direction, and reversing the look direction flips its sign. A flank tilted toward a sensor looking west is tilted away from a sensor looking east. Slopes that lay over on one pass are merely illuminated on the other, and slopes that were fine fall into shadow.
The size of that swing is easy to underestimate. Measured over one volcanic flank, layover covered 2.6% of the area for a sensor looking west and 0.7% looking east — at the same 35° incidence angle. Same terrain, same incidence, nearly a fourfold difference in unusable area purely from which way the antenna pointed.
This is why a default look direction is worse than no answer. If a tool assumes a geometry to produce a number, the number describes a pass that may not be the one you are planning.
Which way do Sentinel-1 and NISAR look?
Opposite ways, and that turns out to be useful. ESA states that the Sentinel-1 C-band radar antenna beam illuminates the ground to the right side of the satellite, with Interferometric Wide swath mode spanning incidence angles from 29.1° to 46.0°. NISAR is left-looking, operating at L-band with a 24 cm wavelength.
For a valley running across both ground tracks, the two missions illuminate opposite walls. A slope shadowed for Sentinel-1 on a given orbit direction can be the well-illuminated slope for NISAR, which makes the pairing genuinely complementary in relief rather than merely redundant. The corollary is the trap: an L-band window is not a drop-in substitute for a C-band one over steep ground, because the geometry differs before the wavelength does.
Within a single mission, the same reversal is available by choosing orbit direction — an ascending pass and a descending pass look at opposite flanks. That is the practical content of ascending versus descending orbits, seen through terrain rather than through illumination.
When is this worth computing?
Whenever the target sits in relief and the decision costs something — waiting several days for a free pass, or paying for a tasked one.
Three cases where the numbers change the plan. A landslide or slope-failure site, where the failure surface is by definition steep and may be exactly the part that lays over; landslide detection lives or dies on this. A valley-floor facility, where the surrounding walls can shadow the target itself on one pass and not the other. And any interferometric work, where layover destroys coherence outright, so a pair chosen without checking geometry can be unusable no matter how good the temporal baseline is.
In flat terrain, skip it. Over a delta or a plain the fractions are near zero on every pass and the effort is wasted.
What this does not tell you
It tells you which ground the radar can measure, not whether the measurement will answer your question. A scene can be geometrically perfect and still show nothing, because the change you care about did not alter the backscatter, or because the resolution is too coarse for the object.
It also assumes the DEM represents the surface at the time of the pass. Where terrain has genuinely moved — after a large landslide, a collapse, or major earthworks — the elevation model is describing the terrain before the event, which is the moment you most wanted this to be right.
For the terminology, the glossary defines incidence angle, slant range, and backscatter. For when the pass itself arrives, see satellite pass prediction, and for keeping a site under observation once you have chosen a geometry, satellite area monitoring.
Layover and shadow fractions computed from a DEM describe the geometry of the terrain model, not a guarantee about a delivered product. Actual scene extent, processing level and terrain correction all affect what you receive.

Remote sensing specialist with 10+ years in satellite data processing and AI. Founder of Off-Nadir Lab. Ph.D. in Informatics (Yokohama National University, 2026). Master's in Earth System Science and Technology (Kyushu University). Co-author, Remote Sensing Encyclopedia. More about the author →