
From a World Event to the Satellite Scenes Over It: One API & MCP Workflow
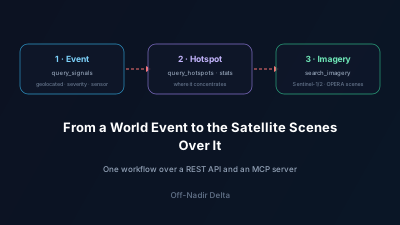
Quick Answer: Reading a news event and finding the satellite imagery over it are usually two disconnected jobs. Off-Nadir Delta joins them in one workflow over a REST API and a Model Context Protocol (MCP) server. First, query_signals returns geolocated world events — each with coordinates, a severity score, and a recommended sensor — filterable by severity band, how precisely the place is established, and market exposure. Then rank_imaging_priority ranks the events in an area by how worthwhile a satellite look is and says which class of satellite each needs — free Sentinel-class data or commercial sub-metre tasking. Finally, search_imagery takes an event's bounding box and returns the Sentinel-1 SAR and Sentinel-2 optical scenes covering it, filtered by date and cloud cover — as scene metadata only, with no imagery bytes and no signed URLs. The Daily World Brief and a usage endpoint are free; the queries are metered on your token balance. Both the REST API and the MCP server are available on every plan, including Free — the only gate is your token balance. An MCP-capable agent like Claude Code runs the same loop as tools after a one-line setup.
A news event gives you two facts a satellite tape cannot: what happened and roughly where. But turning that into imagery — finding the actual Sentinel scenes over the spot, on the right dates, clear of cloud — is normally a separate hunt in a different catalog. This post shows how to do both in one workflow: query world events, rank where a look is most worthwhile, then search the satellite scenes over them, over a REST API for your code and a Model Context Protocol (MCP) server for AI agents. It is the sequel to giving an AI agent live world-event awareness, extended from "what is happening" to "what can I see from orbit."
How do you go from a world event to the satellite imagery over it?
You chain three calls. First, query_signals returns geolocated events, each with coordinates and a recommended sensor. Second, rank_imaging_priority ranks the events in that area by how worthwhile a satellite look is, so you pick a target worth imaging rather than a single wire report. Third, search_imagery takes that area's bounding box and returns the satellite scenes covering it, filtered by date and cloud cover. The same three steps exist as MCP tools, so an AI agent runs the loop conversationally. Each step is a plain HTTP request under /api/v1, authenticated with a bearer API key and metered on your token balance.
| Step | Endpoint | Answers |
|---|---|---|
| 1. Find events | GET /api/v1/signals | What is happening, where, how severe |
| 2. Rank targets | GET /api/v1/collection/priority | Which events are most worth a look, and with what class of satellite |
| 3. Find imagery | GET /api/v1/imagery | Which satellite scenes cover that spot |
What does query_signals return, and how do you filter it?
GET /api/v1/signals returns geolocated world events — geopolitical, security, disaster, and infrastructure — distilled from global news media and enriched with a location whose precision is stated, a severity and GEOINT score, an escalation trend, source links, and a satellite-collection recommendation. The filters are the app's own, with the same choices: bounding box, a date range or a recent time window, and category, and also severity band (4, 6 or 9), stage (how precisely the place is established: reported, localized or pinpointed), and market exposure (oil, grain, shipping, …); you can sort by latest, oldest, or imaging value (geoint). On the Free plan the Watchfloor filters beyond category — among them the severity band, stage, market exposure and free-text search — are not applied, and meta.filter_clamp names the ones dropped; category, bounding box and time window work on every plan. It returns up to 500 rows per page, cursor-paginated.
# High-severity armed-conflict events placed to a town or finer in a bounding box over one week, most worth imaging first
curl -H "Authorization: Bearer ond_..." \
  "https://offnadir-delta.com/api/v1/signals?bbox=30.0,50.0,31.0,51.0&start_date=2026-09-21&end_date=2026-09-27&categories=armed_conflict&min_severity_band=6&stages=localized,pinpointed&sort=geoint"
Each signal carries a collection block — a recommended remote-sensing level and sensor (SAR or optical) for that event — so the response already hints at what to image next. Every signal also links back to its original sources and to a location whose precision is stated, which is what makes the feed evidence-based rather than a black box.
How do you decide which event is worth imaging?
Rank them instead of reading every row. GET /api/v1/collection/priority (MCP: rank_imaging_priority) crosses each event's importance — severity, breadth of reporting and market relevance — with the class of satellite its required resolution demands: coarse (≤100 m), high (≤10 m, answerable with free Sentinel-class data) or very high (sub-metre, commercial tasking). It returns per-class counts and the top targets for a window of up to 30 days (today by default), deterministically and without a language model.
# Which of today's events in the area are most worth a look, and with what class of satellite?
curl -H "Authorization: Bearer ond_..." \
  "https://offnadir-delta.com/api/v1/collection/priority?bbox=30.0,50.0,31.0,51.0&top_n=5"
A high-importance target that needs only the high class is answerable with free Sentinel data — which is exactly what the next step searches. A target that needs the very-high class is what a commercial order is for. Pick a top target's coordinates as the center of the area you want to image.
How do you find the satellite scenes over an event?
Call GET /api/v1/imagery with the event's bounding box. It searches the imagery catalog and returns the scenes covering that area within a date range (start_date / end_date). Supported collections are Sentinel-1 GRD and RTC (C-band SAR) and Sentinel-2 L2A (optical). Sentinel-2 carries a cloud_cover_max filter; the SAR collections see through cloud and darkness, which is why the signal's recommended sensor matters.
# Sentinel-2 optical scenes over the area in a 14-day date range, under 30% cloud
curl -H "Authorization: Bearer ond_..." \
  "https://offnadir-delta.com/api/v1/imagery?bbox=30.3,50.3,30.7,50.6&collection=sentinel-2-l2a&start_date=2026-09-14&end_date=2026-09-27&cloud_cover_max=30"
The response is scene metadata only — id, collection, acquisition datetime, footprint, cloud cover, platform, and a preview URL — with no imagery bytes and no signed URLs. That keeps the payload small and avoids redistributing provider access tokens. To understand the identifiers you get back, the imagery catalog follows the open STAC (SpatioTemporal Asset Catalog) specification; Sentinel-1 and Sentinel-2 are part of the European Union's Copernicus programme. Sentinel-2 images at 10 m resolution with a 5-day revisit from its two-satellite constellation — enough to catch week-to-week change over most events. For how to choose between radar and optical for a given event, see SAR vs optical: when to use which.
How does the same workflow run over MCP for an AI agent?
The MCP server at /api/v1/mcp exposes the same surface as tools, so an agent runs the loop without any glue code. The loop uses query_signals, rank_imaging_priority, and search_imagery, alongside tools such as get_world_brief, get_usage, assess_signal, and ask_analyst; the MCP docs list the full, current roster. It also exposes resources — brief://latest, brief://{date}, signals://schema, and usage://current. Every tool result includes a one-line natural-language summary and structured output carrying the full result. The Model Context Protocol is an open standard for connecting AI applications to external tools and data; see the MCP specification.
# Register the server once (Claude Code); the agent discovers the tools
claude mcp add --transport http off-nadir-delta \
  https://offnadir-delta.com/api/v1/mcp \
  --header "Authorization: Bearer ond_..."
Once registered, a single instruction like "find the most severe escalating event in the Black Sea this week and list the Sentinel-1 scenes over it" makes the agent call query_signals, then search_imagery, and answer with sourced events and real scene IDs — grounded in retrieved facts instead of its training snapshot. This is the agent-facing half of the live world-event awareness workflow.
How is usage metered, and how do you check your balance?
Everything runs on one token balance — the same wallet the app uses — and the API and MCP server are available on every plan, including Free, gated only by that balance. The Daily World Brief (GET /api/v1/brief) and the usage endpoint (GET /api/v1/usage) are free; query_signals, rank_imaging_priority, and search_imagery are metered per query; and the AI assess and analyst endpoints (and their MCP tools) are billed per call. Call GET /api/v1/usage — or read the usage://current MCP resource — to see your remaining balance before spending on a metered call.
# Pre-flight: how many tokens are left, and do I have AI access?
curl -H "Authorization: Bearer ond_..." \
  "https://offnadir-delta.com/api/v1/usage"
Successful responses also carry rate-limit headers (X-RateLimit-Remaining, X-RateLimit-Reset), and query_signals is cursor-paginated via meta.next_cursor. The exact parameters, response shapes, and a machine-readable OpenAPI 3.1 spec live in the API & MCP reference.
Why chain events to imagery instead of using them separately?
Because the value is in the join. An event feed on its own tells you what happened; an imagery catalog on its own makes you already know where to look. Chaining them means the event decides the query — its coordinates become the bounding box, its recommended sensor becomes the collection, its date becomes the window — so you go from a headline to a shortlist of verifiable satellite scenes in three calls. That is the difference between a news API and a geospatial intelligence API: the second one hands the next step, from open-source signal to overhead collection, to whatever is calling it — your code or your agent. For the broader picture of turning open sources into geolocated intelligence, see what is geospatial OSINT.

Remote sensing specialist with 10+ years in satellite data processing and AI. Founder of Off-Nadir Lab. Ph.D. in Informatics (Yokohama National University, 2026). Master's in Earth System Science and Technology (Kyushu University). Co-author, Remote Sensing Encyclopedia. More about the author →