
Modern WebGIS Architecture: How Browser-Based Mapping Platforms Work
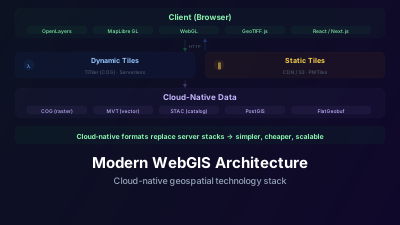
Quick Answer: Modern WebGIS platforms combine several architectural layers: (1) Data storage — cloud-native formats like COG (Cloud Optimized GeoTIFF) and PMTiles enable direct HTTP range requests without dedicated tile servers, (2) Tile serving — raster and vector tiles delivered via XYZ/TMS protocols or generated on-the-fly from COGs, (3) Client rendering — JavaScript mapping libraries (OpenLayers, MapLibre, Leaflet) render tiles and vector data in the browser using WebGL for performance, (4) Analysis — server-side processing for heavy computation, client-side for visualization and simple operations. The shift toward cloud-native formats and serverless architectures has dramatically reduced infrastructure complexity compared to traditional GIS server stacks.
Modern WebGIS architecture rests on a simple idea: let cloud-native data formats do the work that servers used to do. Cloud-native formats eliminate much of the server-side complexity, serverless functions handle on-demand processing, and client-side rendering engines leverage GPU acceleration for smooth interactivity. The result: more capable applications with simpler infrastructure.
It wasn't always this way. Ten years ago, serving geospatial data to a web browser required a stack of specialized software: GeoServer or MapServer for WMS/WFS, PostGIS for spatial queries, a tile cache for performance, and a desktop GIS for data preparation. The infrastructure was complex, expensive to maintain, and brittle.
The Data Layer
What is a Cloud Optimized GeoTIFF (COG)?
The format that changed geospatial data serving. The COG specification defines it as "a regular GeoTIFF file, aimed at being hosted on a HTTP file server, with an internal organization that enables more efficient workflows on the cloud." That internal organization comes down to two structural additions:
- Internal tiling: Data organized in fixed-size tiles (typically 256×256 or 512×512 pixels) rather than scanlines
- Overview pyramids: Pre-computed reduced-resolution versions embedded in the file
These structural features enable HTTP range requests — a client can request just the tiles it needs for the current view extent and zoom level, without downloading the entire file. A 10 GB satellite scene stored as a COG on any HTTP server (S3, Azure Blob, GCS) can be accessed tile-by-tile with no specialized server software. For a hands-on introduction to the format, see Cloud-Optimized GeoTIFF explained.
Vector Tiles (MVT/PMTiles)
Vector data (points, lines, polygons) served as pre-rendered tiles in Mapbox Vector Tile (MVT) format:
- Data is clipped, simplified, and encoded per tile
- Client renders the vectors using style rules (colors, widths, labels)
- Enables smooth zoom transitions and client-side styling
PMTiles: A single-file archive format for vector (or raster) tiles. One file on cloud storage replaces an entire tile server — the client fetches individual tiles via HTTP range requests, similar to COG.
What role does STAC play?
STAC is the discovery layer: a standardized metadata format and API for describing geospatial data so it can be searched by space, time, and properties. In a WebGIS stack, the client queries a STAC API for scenes matching the current map view and date range, then streams the linked COG assets directly. What it provides:
- Searchable catalogs of satellite imagery, DEMs, and other datasets
- Consistent metadata schema across providers
- Links to actual data files (COGs, etc.)
- Enables building data discovery interfaces without proprietary backends
For the full specification and its Items/Collections/API model, see the STAC guide.
How are map tiles served?
Three patterns dominate: pre-generated static tiles served as plain files, dynamic tiles rendered on request from source data, and serverless functions that generate tiles on demand and scale to zero. Which one fits depends on how often the data changes, how large the archive is, and how bursty the traffic gets.
Static Tile Serving
Pre-generated tile pyramids stored as files:
- XYZ convention:
/{z}/{x}/{y}.pngor.pbffor vector tiles (tiled access is now formally standardized as OGC API – Tiles) - Served from any web server, CDN, or cloud storage
- No computation at request time — just file retrieval
- Best for: basemaps, reference layers, datasets that don't change frequently
Dynamic Tile Serving
Tiles generated on-the-fly from source data:
- TiTiler: Python-based dynamic tiler for COGs — reads a COG from cloud storage, extracts the requested tile, applies color mapping, and returns a PNG/WebP
- Martin: Rust-based vector tile server for PostGIS
- pg_tileserv: Lightweight PostGIS vector tile server
Dynamic serving eliminates pre-generation but requires computation per request. Caching (CDN, Redis) mitigates the performance cost for frequently accessed tiles.
Serverless Tile Generation
The newest approach: tile generation functions deployed as serverless (Lambda, Cloud Functions):
- Scale to zero when idle (no infrastructure cost)
- Scale automatically under load
- No server management
- Pay per request
This architecture is particularly attractive for satellite imagery platforms where usage is bursty and datasets are large.
The Client Layer
Mapping Libraries
OpenLayers: Full-featured, supports raster tiles, vector tiles, WMS, WFS, GeoJSON, COG direct reading, and extensive interaction capabilities. Large but comprehensive.
MapLibre GL JS: WebGL-based vector tile renderer forked from Mapbox GL JS. Excellent performance for vector tile rendering and 3D terrain visualization.
Leaflet: Lightweight and simple. Good for basic mapping needs but less capable for advanced rendering or large datasets.
Deck.gl: Specialized in large-scale data visualization (millions of points, complex overlays) using WebGL.
Client-Side Processing
Modern browsers are surprisingly capable for geospatial processing — you can open a GeoTIFF directly in a browser map today without installing anything:
- GeoTIFF.js: Read COG tiles directly in the browser
- Turf.js: Spatial analysis (buffer, intersect, area calculation) in JavaScript
- Web Workers: Background processing without blocking the UI
- WebGL/GPU: Hardware-accelerated rendering for smooth map interaction
The trend is toward moving more processing to the client, reducing server load and latency.
Architecture Component Comparison
| Approach | Key Technology | Latency | Infrastructure Cost | Scalability | Best For |
|---|---|---|---|---|---|
| Static XYZ tile serving | S3/CDN + pre-generated tiles | <50 ms (CDN) | Very low (storage only) | Unlimited | Basemaps, fixed reference layers |
| Dynamic COG tiling | TiTiler + COG on S3 | 200–500 ms | Low (serverless) | Auto-scale | Satellite imagery, analysis products |
| Vector tiles (PMTiles) | CDN + HTTP range requests | <50 ms | Very low | Unlimited | Administrative boundaries, overlays |
| Traditional tile server | GeoServer / MapServer | 100–400 ms | High (always-on VM) | Manual scaling | Legacy WMS/WFS; on-premise only |
| Client-side COG rendering | GeoTIFF.js + WebGL | Depends on file size | None (server-side) | Client-limited | Interactive band math, custom styling |
| PostGIS + vector tile server | Martin / pg_tileserv | 50–200 ms | Medium (DB always-on) | Moderate | Dynamic spatial queries, user data |
| Serverless analysis API | Lambda / Cloud Functions | 1–10 s (cold) | Very low (pay-per-use) | Unlimited | Time series computation, on-demand stats |
Where the cost difference actually comes from: a traditional tile server has to be provisioned for peak load and paid for continuously, whether or not anyone is looking at a map, and it needs a separate cache layer sized for the same peak. A COG-on-object-storage plus serverless-tiler design has no idle cost at all: storage is billed per byte and compute is billed per request. For satellite data platforms — where usage is bursty and archives are large — that structural difference, not raw per-request efficiency, is the main reason for the migration to cloud-native architectures. The trade-off is cold-start latency and per-request cost at sustained high load, which is why heavily-hit basemap layers are still usually pre-generated and served from a CDN.
The Analysis Layer
Server-Side Analysis
Heavy computation remains on the server:
- Time series analysis across hundreds of satellite scenes (the pattern behind satellite area monitoring services)
- Machine learning classification
- Large-area statistics (zonal statistics over millions of pixels) — national-scale systems push this further with frameworks like the Open Data Cube
- Data format conversion and reprojection
Typically implemented as API endpoints that accept spatial/temporal parameters and return results (statistics, derived products, classification maps).
Client-Server Hybrid
Many modern WebGIS applications split analysis:
- Server: Generate band math products, compute statistics, run ML models
- Client: Apply color maps, adjust visualization parameters, perform simple measurements
This hybrid approach provides interactive responsiveness (client-side) while leveraging server computational power for heavy processing.
Authentication and Access Control
Multi-user WebGIS platforms need:
- User authentication: OAuth, JWT tokens, session management
- Data authorization: Which users can access which datasets?
- Usage metering: Track tile requests, API calls, storage consumption
- Rate limiting: Prevent abuse and manage costs
These concerns add architectural complexity but are essential for production platforms.
Performance Optimization
Tile Caching
CDN-cached tiles reduce latency and server load:
- Popular basemap tiles cached globally for <50ms delivery
- Dynamic tiles cached with appropriate TTL
- Cache invalidation when source data updates
Progressive Loading
Good WebGIS UX requires:
- Show low-resolution overview immediately
- Load higher-resolution tiles as user zooms
- Prioritize tiles in the current viewport
- Cancel requests for tiles that scroll out of view
Data Compression
- WebP/AVIF: Smaller raster tiles than PNG (30-50% size reduction)
- Brotli/gzip: Compressed vector tiles (60-80% reduction)
- Quantization: Reduce vector tile coordinate precision where full precision isn't needed
The Evolution
The trajectory is clear: from complex server stacks toward simpler, cloud-native architectures where data formats do the work that servers used to do. A COG on S3 replaces a tile server. PMTiles on a CDN replaces a vector tile server. STAC replaces a custom metadata database.
This simplification doesn't reduce capability — it increases it, because the eliminated server infrastructure was overhead that added complexity without adding analytical value. The compute that matters (analysis, visualization, interaction) is preserved; the compute that was just data plumbing (tile generation, format conversion, cache management) is increasingly handled by intelligent data formats and cloud infrastructure.
For anyone building a WebGIS platform today, the architectural choice is straightforward: cloud-native formats, serverless processing where possible, and capable client-side rendering. The traditional GIS server stack still exists and still works, but the modern alternative is simpler to deploy, cheaper to operate, and more scalable. If you're weighing whether a browser platform can replace desktop tooling for your own workflow, see browser WebGIS vs. desktop GIS.

Remote sensing specialist with 10+ years in satellite data processing and AI. Founder of Off-Nadir Lab. Ph.D. in Informatics (Yokohama National University, 2026). Master's in Earth System Science and Technology (Kyushu University). Co-author, Remote Sensing Encyclopedia. More about the author →