
Volcanic Eruption Monitoring from Space: Detecting Unrest Before Disaster
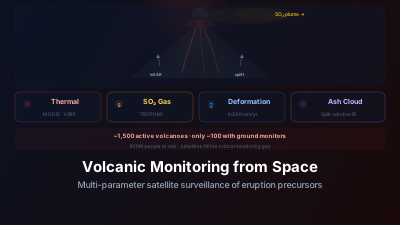
Quick Answer: Satellites monitor volcanoes through four key observables: (1) Thermal anomalies — new lava or fumarolic heating detected by MODIS/VIIRS thermal bands, (2) SO₂ emissions — volcanic gas plumes tracked by TROPOMI, (3) Ground deformation — magma intrusion causes surface uplift detectable by InSAR at mm precision, (4) Ash clouds — infrared split-window technique distinguishes volcanic ash from meteorological clouds for aviation safety. Only ~100 of the world's ~1,500 potentially active volcanoes have ground-based monitoring. Satellites fill this gap, providing global volcanic surveillance at no per-volcano cost.
The January 2022 eruption of Hunga Tonga-Hunga Ha'apai was the most powerful volcanic explosion recorded by modern instruments. The eruption column reached 58 km altitude, the shockwave circled the globe multiple times, and the tsunami affected coastlines across the Pacific. Every phase of this event — from pre-eruption unrest to the eruption itself to the global atmospheric effects — was captured by satellites.
Most volcanoes don't erupt this spectacularly. But roughly 50-70 volcanoes erupt each year somewhere on Earth, and many more show signs of unrest. Monitoring all of them from the ground is impractical and expensive. Satellites provide the only feasible approach to global volcanic surveillance.
The Four Satellite Observables
1. Thermal Anomalies
Volcanic heat sources — active lava flows, lava lakes, fumaroles, heated crater lakes — are significantly warmer than their surroundings. Thermal infrared sensors detect these anomalies:
MODIS/VIIRS: Global coverage multiple times per day at ~375m-1km resolution. The MODVOLC and MIROVA algorithms automatically scan every MODIS/VIIRS image for thermal anomalies at known volcano locations.
Sentinel-2 SWIR: 20m resolution SWIR bands detect smaller, cooler thermal features. Hot lava saturates the SWIR bands (radiance exceeds the sensor's dynamic range), creating distinctive bright pixels. Sentinel-2's higher spatial resolution detects subtle thermal features that MODIS/VIIRS miss.
Landsat TIRS: 100m thermal resolution, 16-day revisit. Good for characterizing thermal output of persistently active volcanoes.
What thermal monitoring reveals:
- Onset of new eruptive activity (fresh lava appearing)
- Changes in eruption rate (lava flow advance rate, thermal output trend)
- Dome growth (viscous lava extruded at the summit)
- Pre-eruptive heating of hydrothermal systems
2. Gas Emissions (SO₂)
Volcanoes emit sulfur dioxide (SO₂) that's detectable from space using UV spectroscopy:
TROPOMI (Sentinel-5P): Detects volcanic SO₂ plumes daily at ~7km resolution. Even passive degassing (non-eruptive SO₂ release) from active volcanoes is detectable.
Significance of SO₂ monitoring:
- Increasing SO₂ flux indicates fresh magma rising toward the surface
- Explosive eruption plumes tracked across thousands of kilometers
- Aviation hazard assessment (SO₂ correlates with volcanic ash presence)
The combination of increasing SO₂ emissions and ground deformation is one of the most reliable indicators of impending eruption.
3. Ground Deformation (InSAR)
Magma moving through the crust displaces the overlying surface. InSAR detects this deformation with extraordinary precision:
Inflation: Magma accumulating in a shallow reservoir causes the surface above to rise — typically a few centimeters over months to years, with a characteristic radially symmetric pattern.
Deflation: Magma draining from a reservoir (during eruption or lateral intrusion) causes the surface to subside.
Dyke intrusion: Magma forcing its way through a crack produces a distinctive asymmetric deformation pattern.
Sentinel-1 InSAR has revolutionized volcano deformation monitoring. Previously limited to volcanoes with GPS instruments (maybe 100 worldwide), InSAR now monitors deformation at every sub-aerially exposed volcano on Earth. The COMET (Centre for Observation and Modelling of Earthquakes, Volcanoes, and Tectonics) programme systematically processes Sentinel-1 data over the world's subaerial volcanoes and publishes the resulting deformation products openly.
4. Ash Cloud Detection and Tracking
Volcanic ash is lethal to aircraft engines. Detecting and tracking ash clouds is an operational aviation safety requirement:
Split-window technique: Volcanic ash and ice clouds have different emissivity properties at 11 μm and 12 μm (thermal infrared). The brightness temperature difference (BT₁₁ - BT₁₂) is typically negative for ash clouds and positive for ice clouds. This allows ash detection even at night.
RGB composites: Combining specific infrared channels creates "ash RGB" products where volcanic ash appears distinctive colors (often red/magenta), enabling rapid visual identification.
Volcanic Ash Advisory Centers (VAACs): Nine centers worldwide use geostationary and polar-orbiting satellite data to issue ash advisories for international aviation. Response time: minutes to hours after eruption detection.
Operational Monitoring Systems
USGS/Smithsonian Global Volcanism Program
Maintains the global database of volcanic activity, integrating satellite observations with ground-based monitoring.
NASA FIRMS for Volcanoes
While primarily designed for fire detection, FIRMS thermal anomaly data is routinely used for monitoring volcanic thermal activity globally.
European Volcano Observatory Space Services (EVOSS)
An EU-funded demonstrator (FP7, within the GMES framework that became Copernicus) that built a satellite-based volcano observatory monitoring ash, gas, ground deformation and temperature, coordinated by the Institut de Physique du Globe de Paris. It ran for 36 months from March 2010 and is now listed as completed (Copernicus); its main legacy is demonstrating that the four observables can be processed together operationally rather than volcano by volcano.
Case Study: Predicting Eruptions
The ideal scenario: satellite data detects unrest → alerts are issued → ground monitoring intensifies → eruption is anticipated
2018 Kīlauea, Hawaii: InSAR had been tracking inflation at the summit for years. When a sequence of earthquakes and increased SO₂ emission accompanied accelerating deformation, the USGS correctly anticipated the eruption and had evacuation plans ready for the affected subdivisions.
2021 La Palma, Canary Islands: ground deformation detected by InSAR alongside GNSS stations, together with an escalating earthquake swarm, indicated shallow magma intrusion in the days before the September 2021 Cumbre Vieja eruption. That combination allowed Spanish authorities to raise the alert and evacuate areas that were subsequently buried by lava flows.
These successes demonstrate the value of satellite monitoring when integrated with ground-based observation and institutional preparedness. But satellite data alone is insufficient for prediction — it identifies unrest, which may or may not lead to eruption.
Why There Is No Universal Threshold Table
It is tempting to want a lookup table — this many tonnes of SO₂ per day, this many centimetres of uplift per month, therefore this alert level. No such table exists, and publishing one would be misleading. Volcano alert levels are set by the responsible observatory (USGS, IGN, INGV, PHIVOLCS and so on) using thresholds calibrated to that volcano's own history, not to a global scale.
The reason is physical. Background degassing at a persistently open-vent volcano can exceed the peak emission of a closed-system volcano that is genuinely about to erupt. Deformation of a few centimetres means something very different at a large caldera, where the same volume change is distributed over tens of kilometres, than at a small stratovolcano. And the same signal at the same volcano can mean different things depending on whether it is accelerating or decaying.
What satellite data supports is therefore relative interpretation:
- Departure from that volcano's own baseline is the signal, not an absolute number. This is the same logic as anomaly detection in any time series.
- Acceleration matters more than magnitude. A deformation rate that is increasing is a stronger indicator than a larger but steady one.
- Co-occurrence across observables is the strongest evidence. Rising SO₂ and accelerating inflation and increasing seismicity together is the combination that has preceded well-forecast eruptions; any one alone is much weaker.
- Sudden deflation following sustained inflation typically indicates magma leaving the reservoir — erupting or intruding laterally.
For any specific volcano, the authoritative interpretation of these numbers comes from the responsible observatory, which has the local baseline that satellite data alone does not supply.
Challenges
Not all unrest leads to eruption: Many episodes of deformation, thermal anomaly, and gas emission resolve without eruption. Satellites detect unrest effectively but can't determine whether it will culminate in eruption.
Cloud cover over tropical volcanoes: Many of the world's most dangerous volcanoes are in tropical settings (Indonesia, Philippines, Central America) with persistent cloud cover that limits optical and thermal monitoring.
Temporal resolution: Sentinel-1's 6-12 day revisit may miss rapid pre-eruptive deformation. Commercial SAR constellations and future missions will improve temporal sampling.
Submarine volcanoes: Most of Earth's volcanic activity occurs underwater and is invisible to current satellite monitoring.
The Monitoring Gap
Only about 100 of the world's ~1,500 potentially active volcanoes have comprehensive ground-based monitoring (seismometers, GPS, gas sensors). Roughly 800 million people live within 100 km of an active volcano.
Satellites don't close this monitoring gap completely — they can't replace seismometers for detecting the earthquake swarms that precede most eruptions. But they provide a crucial first-alert layer: a thermal anomaly or deformation signal at an unmonitored volcano can trigger the deployment of ground instruments and the issuance of early warnings.
In the spectrum of natural hazards, volcanic eruptions are uniquely suited to satellite monitoring — they produce multiple distinct observables (heat, gas, deformation, ash) that satellites can detect independently. No other natural hazard offers this many satellite-detectable precursors. The challenge is institutional: converting satellite detections into timely warnings and preparedness actions for vulnerable populations near the world's poorly monitored volcanoes.

Remote sensing specialist with 10+ years in satellite data processing and AI. Founder of Off-Nadir Lab. Ph.D. in Informatics (Yokohama National University, 2026). Master's in Earth System Science and Technology (Kyushu University). Co-author, Remote Sensing Encyclopedia. More about the author →