
Oil Spill Detection with SAR: How Radar Spots Pollution on the Ocean
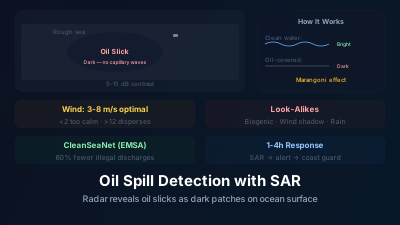
Quick Answer: Oil on water suppresses small-scale surface waves (capillary and short gravity waves), creating smooth patches that appear dark in SAR imagery against the rougher surrounding sea. Sentinel-1 detects oil spills at 10-40m resolution regardless of weather or lighting conditions. The key challenge is distinguishing real oil from natural look-alikes — biogenic slicks from plankton, low-wind zones, current boundaries, and rain cells also produce dark patches. Operational services like CleanSeaNet (EMSA) combine automated detection with expert verification. Detection works best at moderate wind speeds (3-10 m/s); too calm means no contrast, too rough means oil disperses.
In April 2010, the Deepwater Horizon oil rig exploded in the Gulf of Mexico, initiating the largest marine oil spill in history. Over 87 days, approximately 780,000 cubic meters of crude oil flowed into the Gulf. SAR satellites — Envisat ASAR, RADARSAT, TerraSAR-X, and others — repeatedly mapped the spill extent through cloud and darkness, guiding containment and cleanup operations across an affected area spanning tens of thousands of square kilometres.
That response demonstrated both the power and the limits of SAR-based oil spill monitoring. The technology works — but it requires understanding what SAR actually sees and what it can miss.
The Physics: Why Oil Looks Dark in SAR
Ocean SAR backscatter comes primarily from small surface waves — ripples with wavelengths of centimeters, called capillary and short gravity waves. These small waves are generated by wind and are present whenever wind speed exceeds about 3 m/s.
Oil on the water surface dampens these small waves through two mechanisms:
Marangoni damping: Oil changes the surface tension, which alters the restoring force for capillary waves. The modified surface tension suppresses wave formation in the oil-covered area.
Viscous damping: Oil increases the effective viscosity of the surface layer, dissipating wave energy more rapidly.
The result: oil-covered water has fewer small-scale waves → less backscatter → appears darker than surrounding clean water in SAR images.
The contrast can be substantial — 5-15 dB difference between oil-covered and clean sea surface, depending on oil thickness, type, and sea state.
What SAR Can and Cannot Detect
Detectable
- Crude oil slicks: Strong wave damping, typically 3-15 dB contrast
- Refined petroleum products: Moderate damping, lower contrast than crude
- Mineral oil sheens: Thin films (>0.1 μm) produce visible contrast at moderate winds
- Ship bilge discharges: Operational discharges detectable as linear dark streaks
Not Reliably Detectable
- Very thin sheens (<0.05 μm): Insufficient wave damping for SAR detection
- Emulsified oil: Chocolate mousse-like mixtures may not suppress waves effectively
- Submerged oil: Oil below the surface doesn't affect surface roughness
- Oil on ice: No wave contrast mechanism; different detection approach needed
The Wind Speed Window
SAR oil detection requires a specific wind range:
| Wind Speed | Oil Detectability |
|---|---|
| < 2 m/s | Poor: Sea too calm — no waves to dampen, no contrast |
| 2-3 m/s | Marginal: Weak contrast |
| 3-8 m/s | Optimal: Strong contrast between slick and rough sea |
| 8-12 m/s | Decreasing: Oil begins to disperse and submerge |
| > 12 m/s | Poor: Oil broken up and mixed into water column |
This wind dependency means SAR-based monitoring misses oil during calm conditions (common in enclosed seas) and rough conditions (storms disperse oil before it can be imaged).
The Look-Alike Problem
The biggest operational challenge: many other phenomena produce dark patches in SAR imagery that resemble oil spills:
Biogenic slicks: Phytoplankton and other organisms produce natural surface-active substances that dampen waves. These natural slicks are common, especially in productive coastal waters.
Low-wind zones: Wind shadows behind islands, headlands, or large ships create locally smooth water. Current boundaries and convergence zones can also produce calm bands.
Rain cells: Falling rain dampens short surface waves, creating dark patches that can mimic oil.
Grease ice: In polar regions, newly forming ice creates smooth patches indistinguishable from oil in SAR alone.
Discrimination Approaches
Shape analysis: Oil spills tend to be elongated along the wind/current direction with sharp boundaries. Natural slicks are more irregular and diffuse.
Contextual information: Is there a ship track leading to the dark patch? Is there a known platform or pipeline nearby? What's the wind and current direction?
Multi-polarization: Oil damping affects different polarizations differently. VV polarization shows stronger contrast for oil than VH, while natural slicks may show different polarization signatures.
Time series: Real oil persists and moves with currents; weather-related look-alikes are transient.
Optical confirmation: When weather permits, optical imagery shows oil sheens as colored patches (iridescent in thin layers, brown/black when thick).
Operational Systems
CleanSeaNet (European Maritime Safety Agency)
The primary European oil spill detection service:
- Uses Sentinel-1 and commercial SAR satellites
- Automated dark spot detection followed by expert analyst verification
- Near-real-time alerting to coastal states
- Covers European waters and beyond
- Publishes annual detection-and-feedback statistics, in which only a minority of flagged dark spots are confirmed as oil once verified
NOAA SAR for Oil Spill Response
US system using Sentinel-1 and commercial SAR for operational oil spill monitoring. Integrates with the National Response System for spill response coordination.
National Systems
Many coastal nations operate or subscribe to SAR-based monitoring services: Norway, Brazil, Singapore, and others with significant maritime traffic or offshore oil production.
From Detection to Response
The satellite detection workflow:
- Acquisition: SAR satellite passes over the area of interest (planned or opportunistic)
- Processing: Automated algorithms flag dark patches exceeding contrast and size thresholds
- Verification: Expert analysts review each detection, assessing shape, context, and look-alike probability
- Classification: Confirmed oil, probable oil, possible oil, or look-alike
- Alert: Information transmitted to national maritime authority and coast guard
- Response: Aerial surveillance dispatched for confirmation; cleanup resources mobilized if confirmed
Typical latency: operational services aim to deliver an alert within hours of the satellite pass — fast enough for aerial surveillance to be dispatched while the slick is still where the image put it.
Chronic Pollution vs. Acute Spills
SAR monitoring serves two distinct purposes:
Acute spill response (like Deepwater Horizon): Mapping the extent and movement of a known large spill to guide containment and cleanup. High-priority, multi-satellite tasking.
Chronic pollution surveillance: Detecting illegal discharges (bilge dumping, tank washing) from ships. Much marine oil pollution comes not from spectacular accidents but from routine operational discharge. Persistent satellite surveillance, paired with an enforcement route that can act on a detection, is generally credited with a deterrent effect — the vessels are still there, but the incentive to dump changes once being seen becomes likely.
The mechanism matters more than any single figure here: detection on its own changes nothing. Surveillance reduces discharges only where a detection can be attributed to a vessel and followed by a consequence, which is why SAR programmes are paired with AIS and with national maritime authorities rather than run as standalone imagery services.
Detection Performance by Spill Scale
What SAR realistically detects scales with the area of the slick, not its tonnage — and the two are only loosely related, because how far a given volume spreads depends on the oil's viscosity, the sea state, and how long it has been weathering. Calibrate expectations along these lines:
- Small operational discharges (bilge dumping, tank washing) form thin films that are detectable only under favourable winds, and typically appear as narrow linear trails rather than patches. These are the hardest real spills to catch and the easiest to miss between passes.
- Vessel accidents and platform releases produce slicks large and thick enough for reliable detection with Sentinel-1 inside the useful wind window. Ongoing releases need repeat passes, because a single scene captures one moment in a moving, spreading feature.
- Major tanker or blowout events are unambiguous in SAR, and the limiting factor stops being detection and becomes interpretation: weathered and emulsified oil at the edges of a large spill damps waves much less than fresh oil, so the SAR-visible extent understates the affected area. Deepwater Horizon (2010) — roughly 780,000 m³ released over 87 days — also demonstrated the opposite problem, with a significant fraction of the oil remaining subsurface and therefore invisible to any surface-roughness method.
- Biogenic slicks overlap the size range of real spills entirely, which is why they remain the dominant false-positive source rather than a solvable edge case.
On false positives: Operational services flag far more dark patches than turn out to be oil; only a minority of automated detections survive expert verification. That is not a failure of the technology. It reflects both the genuine ambiguity of dark patches in SAR imagery and a deliberately conservative policy — under-flagging a real spill is far more costly than sending an analyst to dismiss a wind shadow.
Limitations and Future
Coverage gaps: Even Sentinel-1 can't image every ocean area every day. Illegal dischargers can time their activities between satellite passes.
Quantification: SAR detects oil extent but not thickness or volume accurately. Thickness estimation from SAR is an active research area but not yet operational.
Subsurface oil: The Deepwater Horizon spill demonstrated that significant quantities of oil can remain subsurface, undetectable by SAR or optical satellites.
Emerging technologies: Compact SAR satellites in larger constellations (ICEYE, Capella) are increasing revisit frequency. AI-based detection is reducing false alarm rates. Combining SAR with AIS (Automatic Identification System) ship tracking data enables direct attribution of detected oil to specific vessels.
Oil spill detection is one of SAR's most mature operational applications. The technology has progressed from research demonstrations to 24/7 operational services that measurably reduce marine pollution. The physical principle is elegant — oil makes water smooth, smooth water reflects radar away, dark patches appear in the image — and the societal value is clear: cleaner oceans through persistent surveillance.

Remote sensing specialist with 10+ years in satellite data processing and AI. Founder of Off-Nadir Lab. Ph.D. in Informatics (Yokohama National University, 2026). Master's in Earth System Science and Technology (Kyushu University). Co-author, Remote Sensing Encyclopedia. More about the author →