
SAR-Optical Data Fusion: Getting More from Two Sensors Than Either Alone
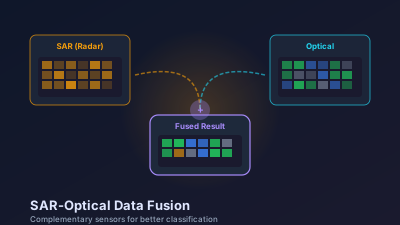
Quick Answer: SAR and optical sensors measure fundamentally different properties — surface roughness/moisture vs. spectral reflectance — so combining them provides complementary information that neither achieves alone. Three fusion levels exist: pixel-level (stack all bands into one multi-sensor image), feature-level (extract features from each sensor independently, then combine), and decision-level (run separate classifiers, merge predictions by voting or probability averaging). Pixel-level fusion of Sentinel-1 VV/VH with Sentinel-2 optical bands generally classifies land cover more accurately than optical alone, but the size of the gain is site-specific — it depends on which classes you are separating, how good your optical coverage already was, and how carefully the two sources were co-registered. Gains are largest in cloud-prone tropical regions, where SAR fills optical data gaps, so treat fusion as a direction of improvement rather than a number you can quote in advance.
Combining SAR and optical imagery generally beats either sensor alone for land cover mapping and change detection, and the gap widens the more cloud there is. The reason is simple: the two sensors measure different physical properties, so their errors are largely independent. How much accuracy you actually gain is site-specific — it depends on which classes you are separating, how good your optical coverage already was, and how carefully the two sources were co-registered — so treat "fusion helps" as a direction, not a number you can quote in advance.
Mangrove mapping in the humid tropics illustrates the point. Optical imagery cannot see through persistent cloud cover, so only a handful of clear Sentinel-2 acquisitions may exist for a given site in a year. SAR acquires regardless of cloud and daylight, but backscatter alone struggles to separate mangrove from other dense vegetation of similar structure. Stacking Sentinel-1 VV/VH backscatter with whatever clear optical scenes are available gives a classifier both structural and spectral evidence — information neither sensor supplies on its own.
Fusion is not just an academic exercise. For mapping problems constrained by cloud cover, or by classes that one sensor cannot separate on its own, combining the two is often the only route to reliable results.
Why Does SAR-Optical Fusion Work?
Fusion works because SAR and optical sensors measure fundamentally different properties of the same surface — geometric structure and moisture versus spectral reflectance — so each one resolves ambiguities the other cannot. Their error patterns are largely independent, which means a classifier combining both can cancel out mistakes that either sensor makes alone. That difference in physics is precisely what makes fusion powerful. (For a broader comparison of the two sensor families, see SAR vs. optical: when to use which.)
Optical sensors measure:
- Surface reflectance in visible, NIR, and SWIR wavelengths
- Chlorophyll content, soil composition, water turbidity
- Color and spectral signatures
SAR sensors measure:
- Surface roughness and geometric structure
- Dielectric properties (moisture content)
- Volume scattering from vegetation canopy
A flooded rice paddy and a calm lake may look identical in optical imagery (both are dark in NIR). But in SAR, the rice paddy produces strong double-bounce scattering from the water-stem interaction, while the lake produces smooth specular reflection. Conversely, two surfaces with identical roughness but different mineral compositions look the same in SAR but are easily distinguished optically.
The key insight: Errors made by one sensor are often independent of errors made by the other. When you combine them, errors cancel out.
Three Levels of Fusion
Pixel-Level Fusion (Early Fusion)
The simplest approach: stack all bands from both sensors into a single multi-band image and process it as one dataset.
For Sentinel-1 + Sentinel-2:
- Sentinel-2: 10 bands at 10-20m resolution
- Sentinel-1: VV and VH backscatter at 10m
- Result: 12-band composite image
Preprocessing requirements:
- Co-registration — images must be geometrically aligned to sub-pixel accuracy
- Resampling — bring all bands to the same pixel size (typically 10m)
- Normalization — SAR backscatter (dB) and optical reflectance have very different value ranges; normalize to comparable scales
When it works well: Random forest and gradient boosting classifiers handle mixed-sensor features effectively because they don't assume uniform feature distributions. Neural networks also handle this well with batch normalization.
When it struggles: When temporal mismatch is large. If your SAR image is from January and your optical image is from June, pixel-level stacking introduces contradictory information (winter SAR backscatter paired with summer reflectance).
Feature-Level Fusion (Middle Fusion)
Extract meaningful features from each sensor independently, then combine the feature vectors.
From optical data:
- NDVI, NDWI, and other spectral indices
- Texture metrics (GLCM contrast, homogeneity)
- Temporal statistics (mean, max NDVI over a season)
From SAR data:
- Mean VV/VH backscatter
- VH/VV ratio (cross-pol ratio, sensitive to volume scattering)
- Temporal coherence (stability over time)
- Texture features from backscatter
Advantages: Each feature is physically meaningful and interpretable. You can assess which features contribute most to classification accuracy. Temporal mismatch is less problematic because features can summarize different time periods.
Decision-Level Fusion (Late Fusion)
Run independent classifiers on SAR and optical data separately, then combine their predictions.
Common strategies:
- Majority voting: Each classifier votes; the majority wins
- Weighted voting: Weight each classifier by its estimated accuracy
- Probability averaging: Average the class probability distributions from both classifiers
- Stacking: Train a meta-classifier on the outputs of both base classifiers
When to use this: When you have already built separate SAR and optical classification pipelines and want to improve accuracy without rebuilding from scratch. Also useful when the sensors have very different spatial resolutions — combining a 10m Sentinel-1 classification with a 30m Landsat classification is awkward at pixel level but natural at decision level.
How Does SAR Fill Cloud Gaps in Optical Time Series?
SAR fills cloud gaps because radar acquires through any weather: Sentinel-1 — which ESA describes as providing "an all-weather, day-and-night supply of images of Earth's surface" — delivers a continuous 6-12 day time series no matter the cloud conditions. In tropical regions, where a pixel might have only 5-10 clear Sentinel-2 observations per year, that continuity is the difference between a usable time series and noise. The fusion approach:
- Build a dense SAR time series (all available Sentinel-1 acquisitions)
- Build a sparse optical time series (cloud-free Sentinel-2 scenes)
- Use SAR temporal patterns to interpolate optical values during cloudy periods
Several Google Earth Engine workflows and research pipelines implement this approach, producing gap-filled optical composites using SAR temporal patterns as a guide for interpolation.
Practical Considerations
Temporal Alignment
Sentinel-1 and Sentinel-2 don't acquire on the same dates, and they aren't flown in a shared orbit — they are separate sun-synchronous missions with different repeat cycles and different local overpass times. For pixel-level fusion you need temporally close pairs, and in practice the short revisit of both missions means acquisitions within a few days of each other are common at mid-latitudes.
Rule of thumb: For agricultural applications, same-week pairs are usually adequate. For disaster response — flood extent mapping, post-disaster infrastructure assessment — same-day or next-day pairs are essential.
Speckle Noise in SAR
SAR imagery contains speckle noise that has no equivalent in optical data. If you're doing pixel-level fusion, the speckle in SAR bands can degrade the classifier's ability to use optical features effectively.
Solution: Apply multi-temporal speckle filtering to SAR data before fusion. Averaging 3-5 SAR acquisitions reduces speckle dramatically while preserving spatial detail.
When Does Fusion Not Help?
Fusion adds little when one sensor already answers the question on its own — and the extra preprocessing, co-registration, and normalization then cost more than they return. Skipping fusion is the right call more often than the literature suggests. Three situations stand out:
- Clear-sky regions with homogeneous landscapes — optical data alone is often sufficient. Adding SAR may add noise without improving accuracy.
- Pure SAR applications (ship detection, oil spill mapping on open water) — optical data adds little value for features that are primarily geometric/roughness-based.
- Very high-resolution commercial imagery — at 30-50cm resolution, the spatial detail in optical imagery is so rich that SAR's contribution is marginal for most applications.
Where fusion consistently delivers: Cloud-prone tropical forests, agricultural mapping in monsoon regions, wetland classification (where water-vegetation mixtures confuse both sensors individually), and urban mapping in complex terrain.
Choosing the Right Fusion Level for Your Application
Not every application benefits equally from the same fusion approach. This guide helps match the method to the objective:
| Application | Recommended Level | Required Temporal Gap (SAR-Optical) | Key Features to Combine |
|---|---|---|---|
| Tropical land cover mapping | Pixel or Feature | < 2 weeks | VV/VH + all Sentinel-2 bands + NDVI seasonal |
| Crop type mapping (monsoon) | Feature | < 1 week during key phenology | SAR temporal statistics + optical seasonal composites |
| Flood mapping | Decision | Same day or next day | SAR change detection + optical inundation extent |
| Urban building footprint | Pixel | < 1 month | Sentinel-1 backscatter + VHR optical |
| Wetland classification | Feature | < 2 weeks | SAR coherence + optical spectral indices |
| Mangrove mapping | Pixel | < 2 weeks | VH backscatter + SWIR optical + tidal composite |
| Forest biomass estimation | Feature | < 1 month | SAR backscatter/coherence + optical NDVI/NDWI |
| Deforestation alert | Decision | Independent | RADD (SAR-based) + GLAD (optical-based) probability |
The temporal gap rule of thumb: For vegetation applications, a 2-week SAR-optical gap is generally acceptable because phenological change is slow. For disaster response (floods, landslides), same-day or next-day pairing is essential — a week's gap renders pixel-level fusion meaningless for change detection purposes.
For the Sentinel-1 + Sentinel-2 combination specifically, the revisit frequency of the two missions means that over well-covered regions you can usually find a pair acquired within a few days. Where observation is sparser, or where cloud thins out the usable optical scenes, week-long gaps are common — which is one more reason feature-level fusion travels better than pixel-level fusion.
Results You Can Expect
Published accuracy figures for fusion vary enormously between studies, because they depend on the class scheme, the reference data, the region, and the classifier — so a single headline number would be misleading. What is consistent across the literature is the shape of the result rather than its size:
- Fusion rarely hurts, and usually helps. Adding an independent physical measurement gives the classifier evidence it did not have.
- The gain scales inversely with how well your primary sensor already performs. Where optical coverage is dense and the classes are spectrally distinct, the improvement is modest and may not justify the preprocessing. Where optical is cloud-limited or the classes are spectrally confusable, the improvement can be the difference between a usable map and an unusable one.
- The biggest gains come from cases where one sensor is nearly blind. Tropical land cover, monsoon-season crop mapping, and wetland classes that mix water and vegetation are the recurring examples.
If you need a number for your own site, the only defensible way to get it is to build both the single-sensor and fused classifications and compare them on the same independent validation set — see how accurate is satellite data for what that comparison should report.
The practical barrier isn't algorithmic — it's preprocessing. Getting SAR and optical data co-registered, temporally aligned, and properly normalized takes more effort than the classification itself. Both Sentinel archives are free through the Copernicus Data Space Ecosystem, so the cost is engineering time, not data. And for operational mapping programs, that preprocessing pipeline only needs to be built once.

Remote sensing specialist with 10+ years in satellite data processing and AI. Founder of Off-Nadir Lab. Ph.D. in Informatics (Yokohama National University, 2026). Master's in Earth System Science and Technology (Kyushu University). Co-author, Remote Sensing Encyclopedia. More about the author →