
Mangrove Mapping with Satellite Imagery: Protecting Coastal Forests from Space
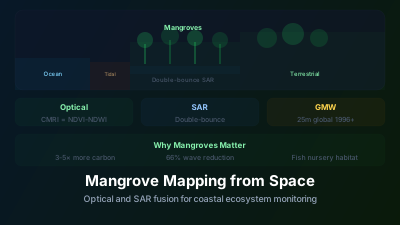
Quick Answer: Mangroves occupy the intertidal zone, making them spectrally distinct from both terrestrial forests (different canopy structure, waterlogged soil) and water. Sentinel-2 NDVI combined with SWIR bands separates mangroves from other vegetation; Sentinel-1 SAR detects mangroves through cloud cover using the distinctive double-bounce signal from trunks standing in water. Global Mangrove Watch maps extent at 25m resolution from 1996-present; its version 3.0 release reports 152,604 km² of mangroves in 1996 falling to 147,359 km² in 2020, a net loss of about 3.4% over 24 years, with the heaviest losses concentrated in Southeast Asia. Mangroves hold exceptionally large carbon stocks per hectare — substantially more than typical terrestrial forest, most of it in waterlogged soil rather than in the trees — so hectares lost and carbon released are not interchangeable figures. Satellite monitoring is essential for tracking loss and verifying restoration projects.
Mangroves are among the hardest ecosystems on Earth to survey on foot. They grow in dense stands of arching aerial roots, rooted in soft tidal mud and brackish water that rises and falls with every tide. A 100-hectare mangrove stand might take a field team a week to traverse. A satellite covers it in milliseconds.
Mangrove mapping from space isn't just convenient — for many remote coastlines, it's the only practical option.
Why Mangroves Are Spectrally Distinctive
Mangroves have several properties that distinguish them from other vegetation in satellite imagery:
Waterlogged substrate: The intertidal soil/water beneath the canopy affects the spectral signal, particularly in SAR where the water surface creates a double-bounce reflection.
Canopy structure: Mangrove canopies are typically dense but relatively short (5-25 m), with a different structure than terrestrial forests.
Species composition: Mangrove species have different leaf properties than most terrestrial vegetation — waxy, thick leaves adapted to salt tolerance.
Location: By definition, mangroves occupy the coastal intertidal zone. This geographic constraint is a powerful classification aid — vegetation in the intertidal zone is very likely mangrove.
Optical Mapping Approaches
NDVI + Elevation/Location
The simplest approach:
- Compute NDVI from Sentinel-2
- Apply a vegetation threshold (NDVI > 0.3)
- Restrict to coastal zones within elevation range (0-10 m above sea level, from a DEM)
- Exclude known non-mangrove vegetation types
This works surprisingly well in many regions because few other vegetation types occupy the low-lying coastal zone.
Spectral Indices for Mangrove Discrimination
CMRI (Combined Mangrove Recognition Index): CMRI = NDVI − NDWI
This index exploits the fact that mangroves have high NDVI (like other forests) but also higher NDWI (due to the wet substrate), giving them a distinctive combined signature.
SWIR-based separation: Mangrove soil is typically wet/saturated, producing lower SWIR reflectance compared to terrestrial forests on dry soil. The ratio of NIR to SWIR helps separate the two.
Multi-Temporal Analysis
Mangroves are evergreen — they maintain green canopy year-round. In regions where adjacent terrestrial vegetation is seasonal (deciduous forests, seasonal crops), a dry-season image clearly distinguishes evergreen mangroves from senesced/bare surroundings.
SAR for Mangrove Mapping
SAR has unique advantages for mangrove monitoring:
Double-Bounce Mechanism
Radar signals hitting the water surface beneath mangrove canopy bounce off the water, reflect off tree trunks, and return to the satellite. This double-bounce produces a strong, characteristic signal in HH polarization (horizontal transmit, horizontal receive).
For Sentinel-1 (VV/VH polarization), the VH channel captures volume scattering from the canopy, while VV includes both surface and trunk-ground interactions. The combination provides reasonable mangrove discrimination.
Cloud Independence
Tropical coasts where mangroves grow are among the cloudiest places on Earth. Optical sensors may not acquire a usable image for weeks. SAR monitors continuously regardless of weather — essential for near-real-time deforestation detection.
Tidal Considerations
Water level beneath the canopy varies with tides. At high tide, more water is present, enhancing the double-bounce signal. At low tide, exposed mudflats reduce the double-bounce. SAR-based mangrove mapping should account for tidal state at the time of acquisition.
Global Mangrove Watch
The Global Mangrove Watch (GMW) dataset provides:
- Global mangrove extent at ~25 m resolution
- Time series: 1996, 2007, 2008, 2009, 2010, 2015, 2016, 2017, 2018, 2019, 2020
- Method: Combination of ALOS PALSAR (L-band SAR) and Landsat optical data
- Classification: Random Forest trained on known mangrove locations
The time series reveals global trends. Global Mangrove Watch version 3.0 reports 152,604 km² of mangroves for 1996, decreasing by 5,245 km² to 147,359 km² in 2020 — an estimated net loss of 3.4% over the 24-year period, despite some areas showing recovery or expansion.
Why Mangrove Loss Matters
Mangroves provide ecosystem services far exceeding their spatial extent:
Carbon storage: Mangroves hold exceptionally large carbon stocks per hectare, most of it in waterlogged soils rather than in the trees themselves — substantially more than typical terrestrial forest on a per-hectare basis. When mangroves are destroyed, this "blue carbon" is released, contributing to greenhouse gas emissions.
Coastal protection: Mangrove roots dissipate wave energy, reducing coastal erosion and storm surge damage. A global synthesis of wave attenuation by mangroves found that "the median value of wave attenuation within the first 100 m of forest is 62 %" (Communications Earth & Environment, 2025), with wide variation depending on forest structure, water depth, and incident wave conditions.
Fisheries: Mangrove ecosystems serve as nursery habitats for commercially important fish and shrimp species. Loss of mangroves directly impacts coastal fisheries productivity.
Biodiversity: Unique species assemblages adapted to the brackish intertidal environment.
Monitoring Loss and Recovery
Deforestation Detection
Mangrove loss is detected similarly to terrestrial deforestation — NDVI drops, SAR backscatter changes — but with additional considerations:
- Aquaculture conversion: The most common driver of mangrove loss (especially shrimp ponds). Regular geometric shapes appearing in mangrove zones indicate aquaculture expansion.
- Coastal development: Urban/port expansion into mangrove areas.
- Natural dieback: Storm damage, sediment starvation, sea level rise.
Restoration Monitoring
Mangrove restoration projects (planting or natural regeneration) can be tracked from satellite:
- Early stage: Seedlings too small to detect spectrally, but changes in tidal flat reflectance may be visible
- Canopy development (2-5 years): Increasing NDVI as canopy closes
- Mature restoration (5-15 years): Spectral signature approaches natural mangrove; SAR double-bounce develops as trunks grow
Satellite monitoring provides independent verification of restoration success — important for projects receiving carbon credit financing.
Regional Patterns and Why Monitoring Matters
Loss is not distributed evenly. Global Mangrove Watch's per-country and per-region breakdowns show that the heaviest net losses cluster in Southeast Asia, where conversion to shrimp aquaculture and coastal urbanisation dominates, while parts of Oceania and the Americas are closer to stable, with change driven more by cyclones, sediment dynamics, and sea level than by direct clearing. Africa sits between the two, with fuelwood extraction, rice farming, and aquaculture as the main pressures. Carbon stock per hectare also varies regionally with forest stature and soil depth — the tall, deep-peat stands of Southeast Asia store far more per hectare than short, sediment-poor stands elsewhere — which is why "hectares lost" and "carbon released" are not interchangeable figures.
The practical consequence is that satellite monitoring earns its value in cadence rather than precision. SAR revisits a mangrove coast on a fixed schedule regardless of cloud, so a clearing event in a protected zone shows up within a revisit cycle rather than at the next field survey; optical adds species and condition context whenever skies allow. That cadence is what makes enforcement and restoration verification feasible at all.
For restoration targets to be verified independently, someone has to measure them. The Global Mangrove Alliance — a network founded by conservation organisations including Conservation International, WWF, IUCN, and The Nature Conservancy — states three 2030 goals: "Halt Loss," "Restore Half" ("bring back half of all restorable mangroves lost since 1996, approximately 397,000 ha"), and "Double Protection" ("increase areas under conservation measures from 40% to 80%"). Satellite time series are the only practical way to check progress against goals stated at that scale.
Challenges
Mixed pixels: Mangrove boundaries are often gradational — dense mangrove transitioning to sparse mangrove to tidal flat to water. At 10-20 m resolution, boundary pixels contain mixtures.
Species-level mapping: Different mangrove species have subtly different spectral signatures, but reliable species discrimination from Sentinel-2 alone is difficult. Hyperspectral sensors or very high-resolution data can improve this.
Shoreline dynamics: Mangrove positions shift with sediment accretion and erosion. What appears as "mangrove loss" in one location may be compensated by "mangrove gain" elsewhere along the coast — natural coastal dynamics rather than anthropogenic destruction.
Definition consistency: Different mangrove area estimates diverge noticeably depending on the classification method, the minimum mapping unit, and whether degraded or sparse mangrove is counted. Global Mangrove Watch itself publishes wide confidence intervals around its headline extent figures for exactly this reason — compare totals only when they come from the same product and the same definition.
Despite these challenges, satellite-based mangrove monitoring has fundamentally improved our ability to track these critical ecosystems. The Global Mangrove Watch and similar initiatives provide the spatial evidence needed to enforce protection, prioritize conservation, and measure the effectiveness of restoration — at scales that ground surveys simply cannot achieve.

Remote sensing specialist with 10+ years in satellite data processing and AI. Founder of Off-Nadir Lab. Ph.D. in Informatics (Yokohama National University, 2026). Master's in Earth System Science and Technology (Kyushu University). Co-author, Remote Sensing Encyclopedia. More about the author →