
Earthquake Damage Assessment from Satellite Imagery: Rapid Response from Space
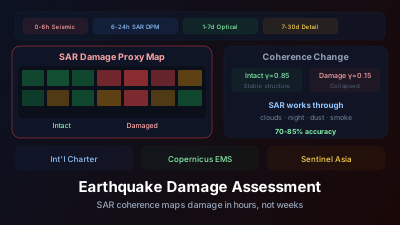
Quick Answer: After an earthquake, satellites provide damage assessment when ground access is impossible. SAR coherence change detection works through cloud and darkness — collapsed buildings lose coherence, producing damage proxy maps at neighborhood scale — but its timing is set by the next satellite pass, which for Sentinel-1 arrives 1-6 days after the event. Optical very-high-resolution imagery (sub-meter) enables building-by-building assessment but requires clear skies. The Copernicus Emergency Management Service and the International Charter activate satellite tasking within hours. Typical workflow: SAR coherence for rapid extent mapping on the first co-event pass, optical confirmation over days 1-7, and detailed assessment over days 7-30. A damage proxy map is a screening product that ranks neighborhoods, not a building-by-building survey, and how well it separates damaged from undamaged areas depends on construction type, settlement density, and the quality of the pre-event SAR archive.
Satellites can map earthquake damage within days of a major event — typically before ground teams reach most affected neighborhoods. SAR coherence change detection works through clouds and darkness, and very-high-resolution optical imagery follows with building-level detail once skies clear. How fast the first map appears is set by one hard constraint: when the next satellite pass over the area actually happens.
The 2023 Turkey earthquakes showed what this looks like in practice. A magnitude 7.8 earthquake struck southeastern Turkey in the early hours of February 6, 2023, and SAR-based damage proxy maps derived from Sentinel-1 followed within the first days — while aftershocks were still ongoing and long before ground teams could survey most of the affected cities — showing responders which neighborhoods had suffered the heaviest structural damage.
That speed — from seismic event to actionable spatial intelligence in a matter of days rather than weeks — represents decades of investment in satellite infrastructure, processing pipelines, and institutional coordination.
The Satellite Response Timeline
Hours 0-6: Event Characterization
Before any satellite imagery is available, seismic data provides the initial assessment:
- Earthquake location, depth, and magnitude from global seismograph networks
- USGS PAGER (Prompt Assessment of Global Earthquakes for Response) estimates potential casualties and economic losses based on shaking intensity and population exposure
This seismic assessment triggers satellite activation.
The First SAR Pass: The Binding Constraint
SAR satellites provide the first imagery-based damage information:
Pre-event archive: Sentinel-1 acquires imagery globally every 6-12 days. Recent pre-event images exist for virtually any location.
Co-event acquisition: The next Sentinel-1 pass over the affected area (within 1-6 days of the event) provides the post-earthquake SAR image.
Coherence change detection: Comparing pre-event and co-event coherence reveals where buildings have collapsed or been severely damaged. Urban areas normally maintain high coherence (0.6-0.9); collapsed buildings produce coherence drops to 0.1-0.3.
The result is a Damage Proxy Map (DPM) — a spatial representation of where coherence decreased beyond the expected natural variation, indicating likely building damage.
Days 1-7: Optical Confirmation
Very-high-resolution optical satellites (WorldView, Pléiades, SkySat) are tasked to acquire imagery over the affected area:
- Sub-meter resolution enables visual identification of collapsed buildings
- Pre-event archive imagery provides the baseline for before/after change detection
- Cloud cover may delay optical acquisition in some events
Days 7-30: Detailed Assessment
Comprehensive damage assessment combining:
- Multiple SAR and optical observations
- Building-by-building damage grading
- Affected population estimation
- Infrastructure damage assessment (roads, bridges, hospitals)
How Does SAR Coherence Detect Building Damage?
Intact buildings scatter radar energy the same way pass after pass, so urban areas maintain high interferometric coherence between SAR acquisitions. When a building collapses, the rubble scatters radar completely differently and coherence drops sharply. Mapping where coherence fell beyond its natural variation therefore maps where structures likely failed — that is the physics behind every damage proxy map. It uses the same phase information that powers InSAR deformation mapping, applied to a different question.
Before earthquake: Buildings are stable, rectangular structures that maintain consistent radar scattering properties between SAR passes → high coherence
After earthquake: Collapsed buildings are piles of rubble with completely different scattering geometry → coherence drops dramatically
Key advantage: SAR, as NASA Earthdata puts it, "enables high resolution imagery to be created night or day, regardless of weather conditions." This is critical because many earthquake-affected areas experience dust, smoke, or weather that prevents optical observation in the first days.
Damage Proxy Map Generation
The standard DPM workflow:
- Select pre-event SAR pair (two images before the earthquake) → compute baseline coherence
- Select co-event pair (one pre, one post earthquake) → compute co-event coherence
- Compute coherence difference: Δγ = γ_pre − γ_co
- Apply statistical threshold: pixels where Δγ exceeds the expected natural variation are flagged as potentially damaged
- Aggregate to building block or neighborhood scale
How Accurate Are Damage Proxy Maps?
A damage proxy map is a screening product, not a survey. It is reliable enough to rank neighborhoods by likely damage and to steer where responders go first; it is not reliable enough to say a specific building is destroyed. Accuracy is highest in dense urban areas, where most pixels contain buildings and coherence is naturally stable, and degrades in sparse or informal settlement patterns. The effective resolution is roughly 100 m, because coherence has to be estimated over a window of pixels rather than a single one. Coarse — but available in any weather, without waiting for cloud to clear. Where a specific accuracy figure matters, take it from the validation published with the individual product, since it varies with construction type, urban density, and the quality of the pre-event archive.
Limitations:
- Cannot distinguish damage severity levels (partial damage vs. total collapse)
- Low-rise buildings produce weaker coherence signals than high-rise
- Decorrelation from non-damage sources (vegetation change, soil disturbance) creates false positives in mixed urban-rural areas
Optical Damage Assessment
Very-high-resolution optical imagery enables detailed damage grading:
European Macroseismic Scale (EMS-98) Grades
| Grade | Description | Visual Indicators from Satellite |
|---|---|---|
| D1 | Negligible | Not detectable from satellite |
| D2 | Moderate | Not reliably detectable |
| D3 | Substantial to heavy | Partial roof collapse visible at <1m resolution |
| D4 | Very heavy | Major structural damage, partial collapse visible |
| D5 | Destruction | Complete collapse, building footprint changed |
Practical threshold: Satellite-based assessment reliably detects D4-D5 damage. D1-D3 typically requires ground inspection.
AI-Assisted Damage Classification
Machine learning models trained on pre/post-earthquake image pairs can automate building-level damage classification:
- Input: Pre-event and post-event VHR optical images
- Output: Per-building damage grade prediction
- Accuracy: markedly better at the binary damaged/not-damaged question than at multi-class grading — separating "very heavy" from "substantial" damage from overhead is hard for models for the same reason it is hard for human interpreters, because the distinguishing evidence is often on the facade rather than the roof
- Speed: Thousands of buildings classified in minutes once imagery is available
Who Activates Satellites After an Earthquake?
Satellite tasking after a major earthquake runs through two main mechanisms — the International Charter "Space and Major Disasters", which pools satellites from member space agencies, and the Copernicus Emergency Management Service, which produces standardized rapid mapping products — plus regional arrangements such as Sentinel Asia. All are activated by authorized national or international agencies, not the public, and deliver products to responders free of charge.
International Charter "Space and Major Disasters"
A consortium of space agencies that provides free satellite data for disaster response:
- Activated by authorized users (national disaster agencies, UN)
- Multiple satellites tasked within hours
- Data delivered to responding agencies at no cost
- Since its first activation in 2000, ESA notes the Charter has "called on space assets on hundreds of occasions"
Copernicus Emergency Management Service (EMS)
EU-operated service providing:
- Rapid mapping products within hours of activation
- Reference maps, delineation maps, grading maps
- Standardized cartographic products for field use
- Historical archive of all activations
Sentinel Asia
Asia-Pacific regional mechanism for satellite emergency response, coordinated through JAXA.
What Drives Damage Proxy Map Quality
Accuracy is not a property of the method — it is a property of the event. The same processing chain produces a usable map in one earthquake and a marginal one in the next, and the difference is almost always explained by four factors:
- Building stock: mid- and high-rise reinforced structures decorrelate strongly and unambiguously when they fail. Low-rise adobe, earthen, and informal construction produces a weaker, more ambiguous coherence signature — which is exactly the construction type that tends to kill people.
- Settlement density: dense urban fabric gives many building pixels per coherence window. Dispersed rural settlement gives few, and the surrounding land dominates the estimate.
- Pre-event archive quality: coherence needs a stable baseline. A location with a long series of consistent pre-event pairs from the same track gives a well-characterized "normal" against which the co-event drop is meaningful; a thin archive does not.
- Land cover around the target: agriculture, vegetation, and bare soil decorrelate naturally between passes, so mixed urban-rural fringes generate false positives that have nothing to do with the earthquake.
Common error patterns:
- False positives: Agricultural fields near urban areas; seasonal vegetation change misread as damage
- False negatives: Partially damaged buildings that maintain geometric coherence; low-rise adobe/earthen construction
- Resolution limitation: DPMs at roughly 100–200 m effective scale cannot detect isolated collapsed buildings — they identify damaged neighborhoods, not individual structures
Why timing changes the product's purpose: survival rates for people trapped in collapsed structures fall steeply over the first three days, so a damage map's value shifts as the clock runs. Maps that arrive during the search-and-rescue phase are prioritization tools — they answer "which district first." Maps that arrive later answer different questions: damage extent reporting, reconstruction planning, and humanitarian logistics. Both are worth producing; they are not the same product.
Case Studies
2023 Turkey-Syria Earthquakes
- Sentinel-1 damage proxy maps produced in the days immediately after the event
- Identified most heavily damaged areas in Antakya, Kahramanmaraş, and surrounding cities
- Optical imagery from multiple commercial and government satellites provided building-level assessment
- Damage grading was produced at scale across many affected cities — far faster than field survey could have covered the same footprint
- Products fed into prioritization during the search and rescue phase
2024 Noto Peninsula, Japan
- Dense cloud cover prevented optical observation for 48+ hours
- SAR coherence maps provided the only spatial damage information during the initial response
- Identified concentrated damage in Wajima and Suzu cities
- Demonstrated the operational necessity of SAR for winter/cloudy earthquake events
2015 Nepal Earthquake
- Pioneering use of crowdsourced damage mapping (OpenStreetMap + satellite imagery)
- Demonstrated that volunteer networks can scale damage assessment faster than institutional capacity alone
- Led to improved protocols for integrating volunteer and professional damage assessment
The Future
More SAR capacity: New missions — including the NASA-ISRO NISAR (how L-band differs from Sentinel-1) L-band mission, launched on 30 July 2025, and commercial constellations with finer resolution — improve both revisit frequency and building-level damage detection.
AI automation: End-to-end automated damage assessment pipelines are reducing the time from image acquisition to damage map from hours to minutes.
Real-time SAR: Planned SAR constellations will provide revisit times of hours rather than days, enabling near-real-time damage monitoring as aftershocks continue.
Integration with ground data: Combining satellite damage maps with ground sensor data (seismometers, IoT building sensors) and social media reports for comprehensive situational awareness.
The speed and coverage of satellite-based earthquake damage assessment have improved dramatically over the past decade. What once took weeks now takes hours. The satellite doesn't replace boots on the ground — rescue teams must still reach affected areas physically — but it tells them where to go first, and that prioritization saves lives.

Remote sensing specialist with 10+ years in satellite data processing and AI. Founder of Off-Nadir Lab. Ph.D. in Informatics (Yokohama National University, 2026). Master's in Earth System Science and Technology (Kyushu University). Co-author, Remote Sensing Encyclopedia. More about the author →