
Satellite Data in Insurance: How Imagery Transforms Risk Assessment and Claims
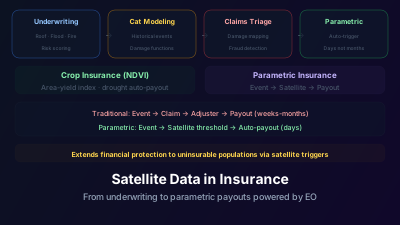
Quick Answer: Insurance companies increasingly use satellite imagery across the policy lifecycle: pre-underwriting risk assessment (roof condition, flood exposure, vegetation encroachment), catastrophe modeling (historical disaster footprints), claims triage (post-event damage prioritization), and parametric insurance (automatic payout triggered by satellite-measured conditions). Crop insurance relies heavily on satellite NDVI for area-yield verification and drought index triggers. Post-disaster, satellite damage maps help insurers prioritize adjuster deployment and estimate insured losses within days rather than weeks. The shift toward parametric products — where satellite measurements directly trigger payouts without claims filing — represents the most fundamental change satellite data enables in insurance.
Insurers now use satellite imagery at every stage of the policy lifecycle: pricing risk before underwriting, triaging claims after disasters, verifying crop losses, and triggering parametric payouts automatically. The clearest illustration is a catastrophe. After Hurricane Ian struck Florida in September 2022 — an event Swiss Re Institute assessed with "estimated preliminary insured losses of $50 billion–$65 billion" — insurance companies faced the operational challenge of processing hundreds of thousands of claims simultaneously. Traditional claims processing — sending adjusters to physically inspect each property — would have taken months. Satellite and aerial imagery enabled rapid triage: identifying the most severely damaged areas first, routing adjusters efficiently, and in some cases approving claims without physical inspection based on imagery evidence.
This is the operational side of satellite data in insurance. The strategic side — using satellite data to understand and price risk before disasters occur — is equally transformative.
How do insurers assess risk before underwriting?
Before a policy is written, imagery answers two questions: what is the condition of the insured asset, and what hazards surround it. Roof condition, vegetation encroachment, flood exposure, and wildfire fuel load are all measurable from satellite and aerial data, which lets insurers screen applications and price risk without sending an inspector to every property.
Property Condition Assessment
High-resolution satellite and aerial imagery reveals property characteristics relevant to insurance risk:
Roof condition: Damaged, aging, or poorly maintained roofs are visible in VHR imagery. Some insurers use AI-based roof condition scoring from aerial imagery to screen property applications.
Vegetation proximity: Trees overhanging structures increase wind damage risk. Vegetation encroachment toward buildings is measurable from satellite-derived canopy maps.
Flood exposure: Satellite-derived elevation models and historical flood extent maps from SAR assess flood risk more accurately than FEMA flood maps, which may be outdated. Sentinel-1 provides the free, systematic radar archive most of these flood maps are built from.
Wildfire exposure: Vegetation density, terrain, and proximity to wildland-urban interface — all satellite-measurable — determine wildfire risk scoring.
Portfolio Risk Analysis
Insurers assess aggregate risk across their entire portfolio:
- Concentration of insured properties in flood-prone areas (satellite flood mapping)
- Exposure to sea level rise and coastal erosion (satellite altimetry, shoreline change detection)
- Urban heat island effects on climate-related claims (satellite thermal data)
Catastrophe Modeling
Catastrophe models estimate potential losses from future disasters. Satellite data improves these models:
Historical event calibration: Satellite-mapped historical disaster footprints (flood extents, hurricane wind fields, earthquake damage zones) calibrate the model's hazard component.
Exposure data: Satellite-derived building footprints, heights, and land use classify the assets at risk.
Vulnerability relationships: Comparing satellite-observed damage patterns against building characteristics refines damage functions (how much damage a building of type X sustains from hazard intensity Y).
How does satellite imagery speed up claims triage?
After a catastrophe, imagery lets insurers map the damage footprint within days, rank affected areas by severity, and route adjusters to the worst-hit properties first — compressing a triage process that traditionally took weeks. In selective cases, claims are settled from imagery evidence alone.
Rapid Damage Assessment
Within days of a catastrophic event, satellite imagery enables:
Damage footprint mapping: SAR coherence change or optical before/after comparison identifies the overall affected area.
Severity classification: Areas categorized by damage severity help prioritize response — adjusters sent to high-severity areas first.
Property-level assessment: At VHR resolution (<0.5m), individual building damage (roof loss, structural collapse, debris) is visible. Some claims can be settled based on imagery evidence without physical inspection.
Fraud Detection
Satellite time series reveal discrepancies:
- Claims for damage to structures that don't exist (no building visible in satellite imagery)
- Claims for pre-existing damage (damage visible in pre-event imagery)
- Claims from areas outside the verified event footprint
Crop Insurance
Agriculture insurance is perhaps the most mature application of satellite data in the insurance industry:
Area-Yield Index Insurance
Instead of inspecting individual farms:
- Monitor NDVI across a region throughout the growing season
- Compare current-season NDVI against historical average
- If area-wide NDVI falls below a threshold → payout triggered for all policyholders in the area
This approach eliminates the need for individual farm inspections, reducing administrative costs dramatically and enabling insurance in regions where physical inspection is impractical.
Drought Index Insurance
Parametric crop insurance products triggered by satellite-measured drought indicators:
- NDVI anomaly (vegetation stress)
- Soil moisture (from SMAP or Sentinel-1)
- Rainfall deficit (from satellite precipitation estimates)
When the satellite-measured index crosses a predefined threshold, payouts are automatic — no claims filing, no adjuster visits, no disputes about individual farm conditions.
Individual Farm Monitoring
For higher-value policies, satellite monitoring at farm level:
- Verify that claimed crop types match satellite-observed crops
- Detect harvest timing anomalies
- Monitor for prevented planting (field not planted despite insurance claim for crop loss)
What is parametric insurance?
Parametric insurance pays out automatically when an objectively measured index — flood extent, wind speed, vegetation condition, ground displacement — crosses a predefined threshold, with no claims filing and no adjuster visit. Because satellites supply exactly this kind of independent, repeatable measurement, parametric products are the most satellite-native part of the industry, and the most fundamental change satellite data enables:
Traditional insurance: Event → Damage → Claim → Assessment → Payout (weeks to months)
Parametric insurance: Event → Satellite measurement exceeds threshold → Automatic payout (days)
Examples:
- Hurricane parametric: Wind speed measured by satellite (SAR, scatterometer) at the insured location triggers payout proportional to wind intensity
- Flood parametric: SAR-measured flood extent covering the insured area triggers payout
- Drought parametric: Satellite vegetation index below threshold triggers agricultural payout
- Earthquake parametric: Satellite-measured ground displacement (InSAR) in the insured area triggers payout. NASA Earthdata notes that InSAR measurements are "very accurate (up to the centimeter level) and can be used to identify areas of deformation following events like volcanic eruptions and earthquakes" — precision that makes displacement a workable contractual trigger
Parametric products eliminate the claims process entirely — reducing fraud, administrative cost, and payout delay. The trade-off: "basis risk" — the satellite measurement may not perfectly correspond to actual losses at individual properties.
Satellite Applications Across the Insurance Lifecycle
| Insurance Stage | Application | Satellite Method | Speed vs. Traditional | What It Changes |
|---|---|---|---|---|
| Pre-underwriting | Flood exposure scoring | SAR historical flood maps + DEM | Near-instant (automated) | Observed flood history refreshes continuously, unlike static regulatory flood zones |
| Pre-underwriting | Wildfire risk scoring | Sentinel-2 vegetation density + terrain | Automated portfolio screening | Replaces manual field assessment |
| Pre-underwriting | Roof / property condition | VHR optical (0.3–0.5m) + AI | Days (batch processing) | Screens the book before an inspector is dispatched |
| Catastrophe modeling | Historical hazard footprints | Landsat/SAR archives (1984–present) | Already computed | Four decades of observed event footprints, not just loss records |
| Post-event claims triage | Damage area prioritization | SAR coherence + VHR optical | 1–4 days post-event | The whole affected region is assessed in one pass rather than property by property |
| Post-event claims | Property-level damage | VHR optical (<0.5m) + AI | 3–7 days post-event | Claims settled without field adjuster (selective) |
| Crop insurance | Area-yield NDVI verification | Sentinel-2 NDVI time series | Weekly throughout season | Removes the need for farm-by-farm inspection |
| Parametric crop | Drought index trigger | SMAP soil moisture / NDVI anomaly | Automatic (threshold-based) | Payout within days; zero claims filing required |
| Fraud detection | Pre-event baseline comparison | Multi-year satellite time series | During claims processing | Inconsistent claims flagged without a site visit |
The Hurricane Ian case (2022): An event of that scale — insured losses in the tens of billions across hundreds of thousands of properties — is exactly where imagery-led triage matters, because the constraint is not the assessment of any one house but the sequencing of an adjuster workforce that is far too small for the queue. Mapping the damage footprint first, then routing adjusters by observed severity, changes the order in which claims are touched. Published, audited figures on how much that shortened settlement in Ian specifically are not publicly available, and any single number should be treated with suspicion.
Challenges
Resolution vs. cost: Damage assessment at individual property level requires sub-meter imagery, which is expensive. Sentinel-2 is free but at 10m resolution can only assess area-level impacts.
Cloud cover timing: Post-disaster satellite observation depends on clear skies. Cloud cover can delay optical imagery for days after an event — frustrating when rapid assessment is needed. SAR provides weather-independent imaging but with more limited damage detection capability.
Model validation: Using satellite data to calibrate catastrophe models requires consistent, quality-controlled event databases spanning many years and many events. Building these databases is an ongoing effort.
Regulatory acceptance: Insurance regulators in some jurisdictions require specific claims assessment procedures that may not yet accommodate satellite-based assessment. Regulatory frameworks are evolving but unevenly.
Privacy concerns: High-resolution satellite monitoring of individual properties raises privacy questions, particularly for continuous monitoring applications.
The insurance industry's adoption of satellite data is accelerating because it addresses fundamental operational challenges: assessing risk at scale, responding to catastrophes efficiently, and creating new product types that serve previously uninsurable populations. Parametric insurance enabled by satellite measurements has the potential to extend financial protection to hundreds of millions of people in developing countries who currently have no access to crop or disaster insurance.
Related reading
Beyond post-event claims, imagery increasingly informs standing exposure. For monitoring accumulating operational risk between events, see port congestion and supply-chain risk for cargo and business-interruption exposure, and watching mines, tailings dams, and industrial sites from space for facility-level environmental risk.

Remote sensing specialist with 10+ years in satellite data processing and AI. Founder of Off-Nadir Lab. Ph.D. in Informatics (Yokohama National University, 2026). Master's in Earth System Science and Technology (Kyushu University). Co-author, Remote Sensing Encyclopedia. More about the author →